I am writing an indicator that reads a .csv file and then simply plots the values in the file in a histogram fashion. The format of the file is:
Date Value
mm/dd/yyyy x1
mm/dd1/yyyy x2
etc etc
I need it to plot the values in the second column i.e. "Value" at the corresponding dates.
So far I've just written the code to open the file but I'm unsure as to how to do the graphical component of the indicator.
Also:
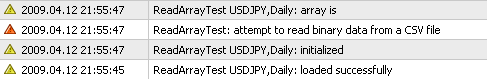
double array;
FileReadArray(handle, array, 0 , 2);
FileClose(handle);
is that the correct code to read the .csv file?
Thanks.
EDIT: I'm also having difficulty with dates. Is there another way other than using seconds?
string strDate = "2007.6.15";
datetime dDate = StrToTime(strDate);
Saw that code somewhere... not sure what it means though... I've never used datetime before or string.
Date Value
mm/dd/yyyy x1
mm/dd1/yyyy x2
etc etc
I need it to plot the values in the second column i.e. "Value" at the corresponding dates.
So far I've just written the code to open the file but I'm unsure as to how to do the graphical component of the indicator.
Also:
double array;
FileReadArray(handle, array, 0 , 2);
FileClose(handle);
is that the correct code to read the .csv file?
Thanks.
EDIT: I'm also having difficulty with dates. Is there another way other than using seconds?
string strDate = "2007.6.15";
datetime dDate = StrToTime(strDate);
Saw that code somewhere... not sure what it means though... I've never used datetime before or string.