Great simple strategy. Like many traders I feel as if I’ve played with just about every indicator under the sun but it wasn’t until I got back to simplicity that things began to turn around. I love simplicity!
Anyways, I trade trendline breaks (buy or sell). The only variation is that I use one indicator (only one!) to confirm the trendline break. I use MACD with settings of 3,10,1. Once there is a close outside the trendline I wait until the MACD goes negative or positive depending on the direction of my trade.
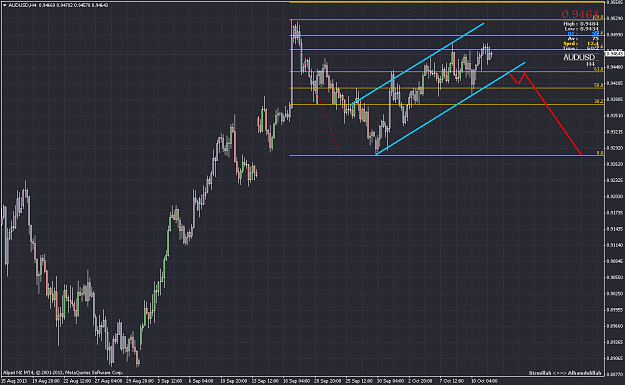
I only trade the AUD/USD. Spread is a bit higher but I like it’s price action better than the EUR/USD. I set my S/L to 10 and T/P to 10 as well. I stop trading when I am net +1.5 for the day. So for example, risking 4% per trade I would net 6% for the day. I usually move my S/L to even in the area of 6 pips. It also helps to be aware of the 50% level of the move. The last setup in the example below ran straight to the 50% level on the setup bar. I should’ve waited for a pull back but it worked out anyways…barely!
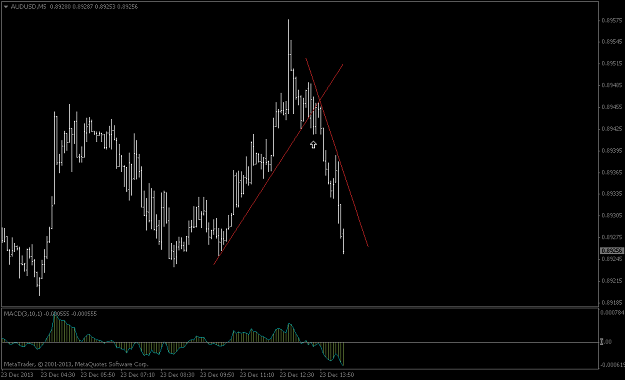
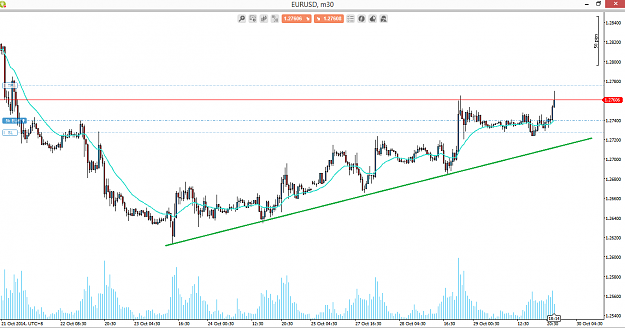
Here is what has panned out so far today on the AUD/USD 5M.
Trade 1 - Steep trendline which knocked me out. Hindsight; waiting for trend slope to decrease would have been wiser.
Trade 2 - Successful with a 10 pip stop.
Trade 3 - Loss. Sometimes these short trendlines work and sometimes they don't. Not every trade wins.
Trade 4 - Possible reentry point if you didn't catch trade 2 or reversed when trade 3 showed up.
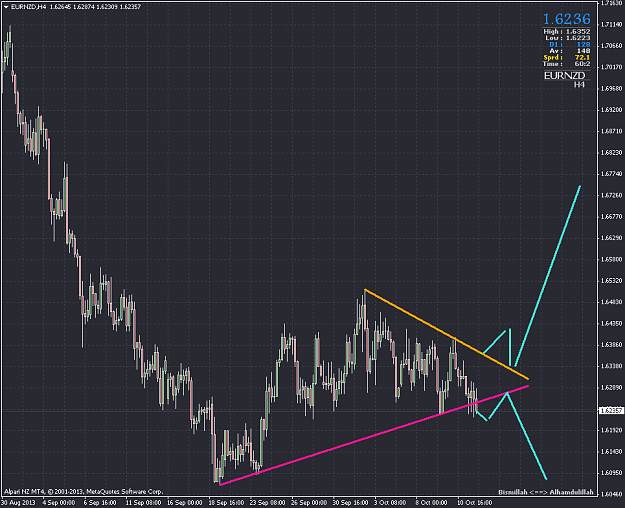
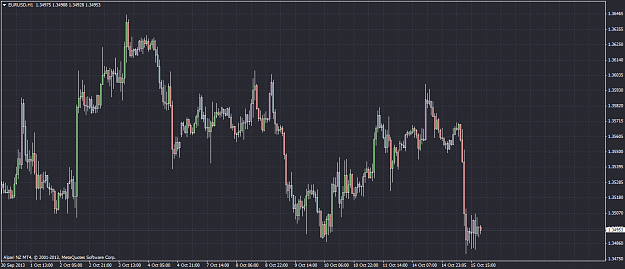
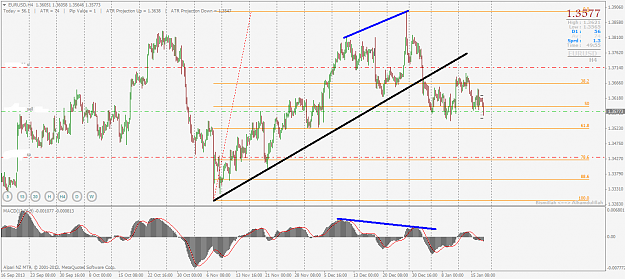
I'm currently watching for the uptrendline to break to the downside. Note, there is nice divergence showing on the 1H timeframe. Also there was 5m divergence showing prior to trade 2 reinforcing the up move.
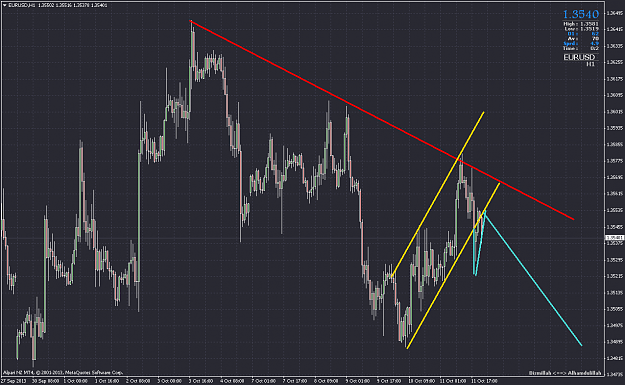
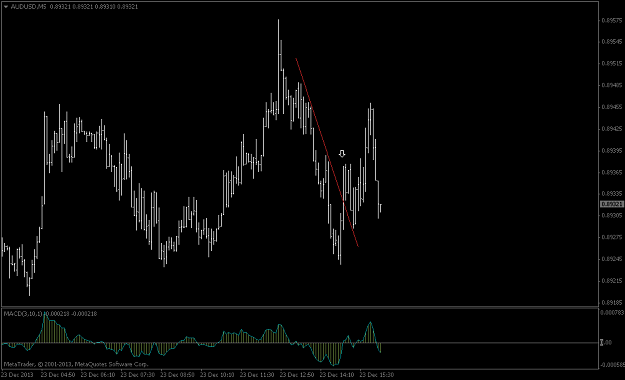
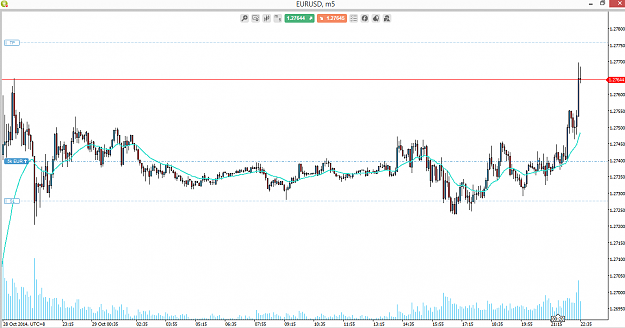
Here is the break of the uptrend line that I mentioned above. Next setup I'm watching for is a close above the downtrend line with confirmation on the MACD.
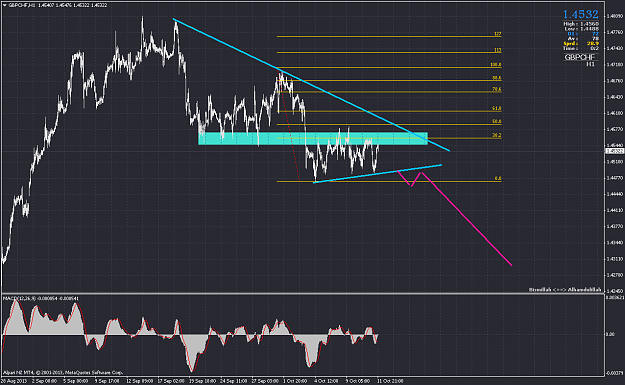
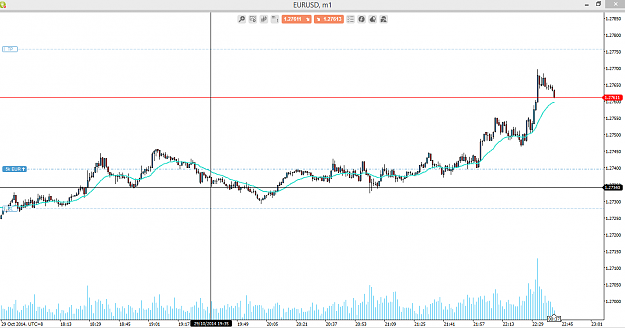
This trade was good for about 8 pips minus spread. Enough to get to even or just take a few and call it a day. Note that hidden divergence showed up which could be used as an exit trigger or signal to tighten stops.
I wonder why this great trading method is not supported ,It has been long since i posted on FF because i have not made any head way in my trading ,I left trading for the past 2 years and just came back 2mths ago ,I am now using trendlines and the results are amazing.My advice is simple ,MM must be really good,draw trend lines on the monthly,daily,4hr and 1hrs. look out for areas of previous S and R they are good in determining exits or profit target.Lastly be brave and take the trade.with good MM if you lose you can still come out profitable at the end of the month.
I was a technical anlayst in stocks and a prop trader for a few years. Now I am a full time forex trader trying to figure out this forex game.
I find your post on trendline break strategy very interesting. Personally I am not using trendline break to generate trading signal. But I am incorporating this in my multi-timeframe micro-trend trading strategy that I am working on. I use trendline break and moving averages to tell me if all the three timeframe charts all point to the same trending direction. If all the three timeframe chart tell me that market is in uptrend , then I will only go long. The converse is also true.
Hi. This is my first time posting. I've had a fascination with trendlines since my first commercial trading strategy failed and I needed to get back to basics.
I've spent the last few weeks coding a custom indicator to draw trendlines on indicators (e.g. Moving average, MACD, RSI, etc.). I've been visually seeing these trendlines and haven't been able to trust them until I was able to systematically draw every one of them! So after 100s of hours of sweat and tears I've got this wow indicator. In this version (4) it draws trendlines on moving averages (and by setting moving average=1, it draws based on close, high, low, both, all three).
It really opens up the trading opportunities on trendlines.
I had the 'mad' idea that I could find good trading opportunites by changing the period of the indicator until it allowed the drawing of a 3 point trendline. An immediate reaction could be that this would over-optimising, however in my experience it doesn't. It does identify natural rhythms that are hidden in waves of price movement.
I don't want to hijack this forum, so I'll start a new forum as soon as I can as a new member. I'm keen to collaborate as I'm a bit tired from all the single-minded focus on coding! This indicator outputs the breakouts to an IndexBuffer so it could be fed into an EA. The indicator doesn't qualify whether a trendline is worth trading (ie whether its a reversal or moving into a consolidation, there's price confirmation, MACD confirmation, risk/reward, etc.). So I'm keen to work with others who can provide the EA and optimisation components to test filters.
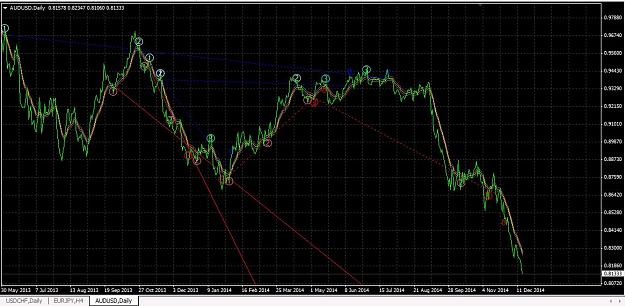
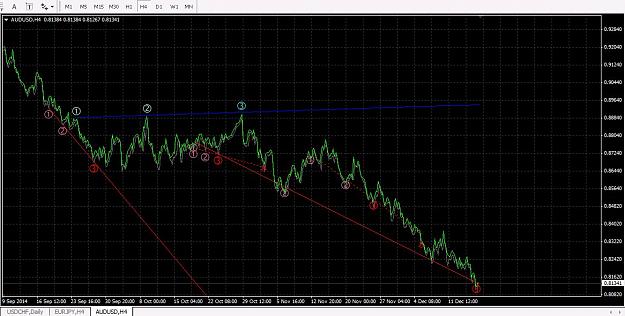
The green line is the close price (candles turned off). The orange is the last drawn indicator period (ie EMA(7-9) shows EMA(9) on screen). The grey lines are the tolerance for a trendline touch on the 2nd apex. Dotted lines are trendlines that have had breakouts, solid are still active. (The 1,2,3 apex markers can be turned off).
Attached Image (click to enlarge)
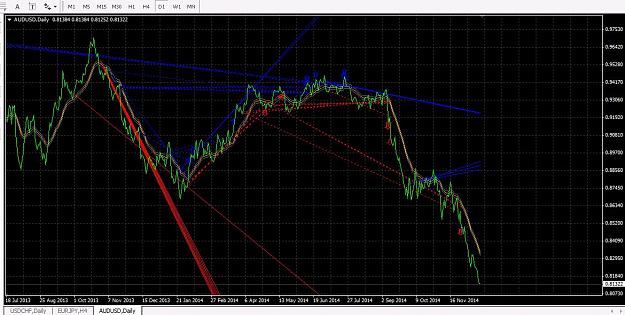
Daily: Using exponential MA(periods=9 to 12) on close with duplicates removed that share 2 time points.
Attached Image (click to enlarge)
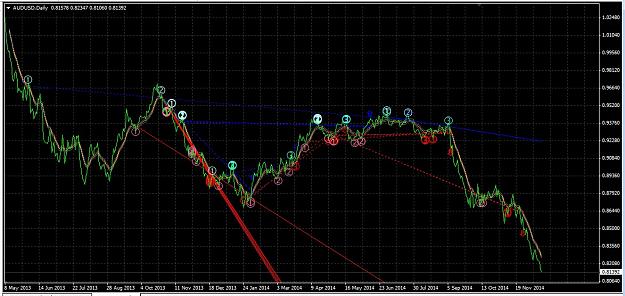
Daily: This one is opening the parameters wider - EMA(7-12) on close with all duplicates.
Attached Image (click to enlarge)
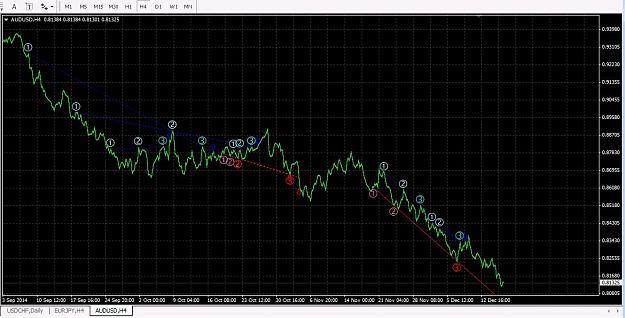
4 hour: Close price only i.e. EMA(1) with duplicates removed. It can also plot high & low price values (like traditional high/low trendlines), however I need to tighten the code as it currently shows breakouts long and short on both high and low prices (rather than long breakouts on highs & short breakouts on lows).
Attached Image (click to enlarge)
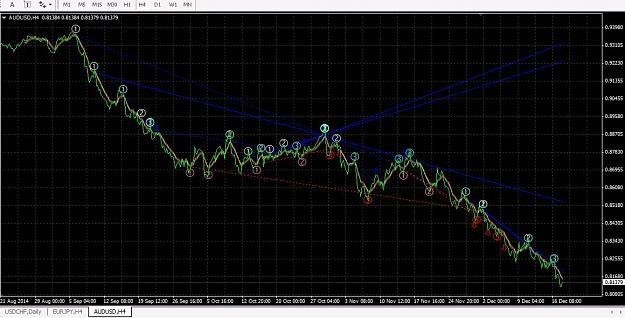
4 hour: EMA(7-9) with duplicates removed.
Future development - v4 - improve duplication removal algorithm, restrict high & low price plotting to traditional method, v5 (next year) - open code up to trendlines on any indicator you wish, drawn in a separate window.
Try it out... (place in Indicators folder of MT4 and then draw into chart window)
Variables worth initial testing are: INDperiod1, INDperiod2, TouchTolApex2, DrawPoints, RemoveDuplicates
The default values are set on exponential moving average 7-12 of close price, ATR(90) tolerance of 0.05 for apex 2, showing draw points, removing duplicates.
Settings are described in more detail here...
(Time limit on this version: 15 Jan 2015. After that date trendlines are delayed by 45 bars. I'll have another version by then, though. I'm not sure whether to release the source code to people I'm collaborating with, release it unequivocally, or later sell it on mlq5 marketplace. Any feedback/experience welcome. I have no experience of selling indicators/EAs).
One more for fun...
Attached Image (click to enlarge)
Wide open parameters - EMA(5-21) with duplicate trendlines not removed (based on default = close)
P.S. Have you noticed what happens when trendlines converse or diverge?
I'm seeing that converging trendlines often have the goodies, identify a major transition point at the point that they cross (a reversal, breakout or end of a trend), where as divergent trendlines lead to resistance waves / consolidation. Or is it just my imagination?
Fx4chick - A simple EA could test the 3rd Wave Algorithm indicator for a recent breakout in three timeframes. How often do they happen? Within how many bars of the lower timeframe can the breakout in the higher timeframe be, to qualify for trading?
I've made quite a few improvements and there's still a few more needed to the code. Not all possible trendlines are being drawn. I should have a new version in a couple of weeks.
More display & testing options have been added. (e.g. added option to not display trendlines that price does not confirm breakout in next x bars. Good for looking back and seeing only historical trendlines you would have actually traded using a strategy of price exceeding breakout bar).
Plus added a traditional trendline override option, to display only high low trendlines on price. This is set as the default.