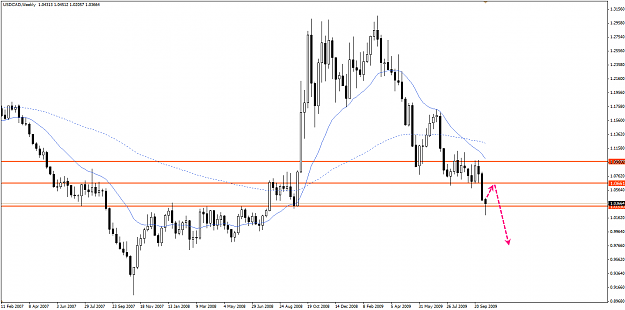
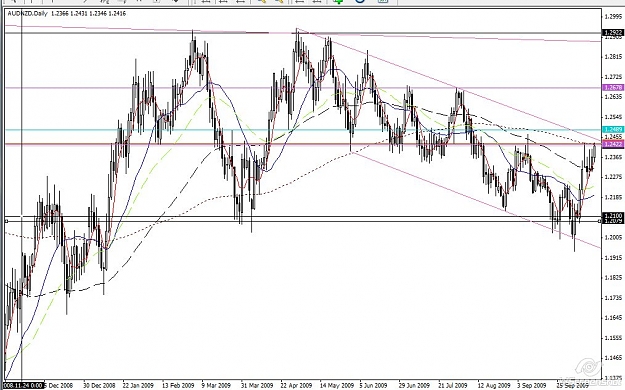
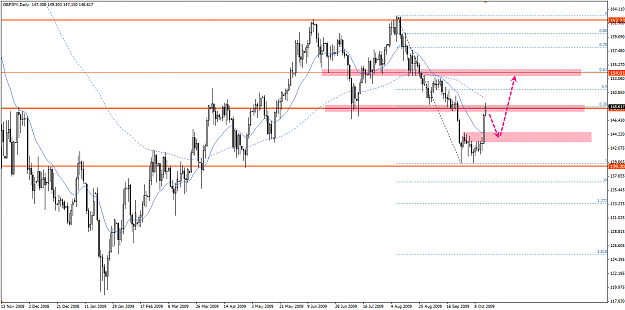
BIG BOSS and BOSS are bearish. Previous week was a high momentum bearish week, this week continued on the bearish path and was rejected by the powerful support zone at ~1.03 leaving behind a hammer.
While the hammer is a bullish sign especially considering its location I wouldn't look for any long positions considering the bearish momentum of the previous week.
Instead I am waiting to see if it gets back up to resistance at ~1.06 and there I will look for bearish patterns to get short.
P.S. Strat, or others, do you find high probability trading long considering the weekly hammer? I don't, but would like to know if others see things different...
Have a new profitable week everyone!
Attached Image (click to enlarge)
Trading = a mirror to your human flaws. Fix them or be fixed.
Despite the teachings on this thread and our posts not to trade the Beast, it would appear that Cosmo has been savaged, ravaged and spit out in little pieces by The Beast. RIP[/quote]
Goodaye Strats, Just dropped bye to see how you guys are doing, savaged, ravaged & spit out.. not at all cobber... i've been learning a lot from another thread also based on trading the daily timeframe.. i'm obviously learning very little here based on my previous view on the direction of the GJ but based on what i have learnt since then, here is my current view, write this down, SELL GJ @ 148.00, TP 141.00... hang on for the ride guys!
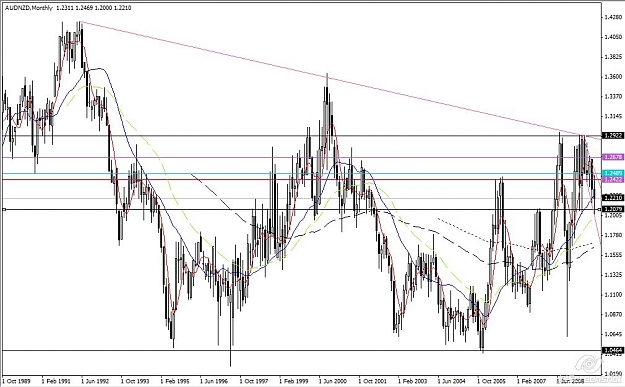
Have been looking at aud/nzd for a few weeks now.Thinking it may have got to the time of trying a trade here.
Big Boss: makes a setting for ranging down, lower highs and trying to break 1.0464 half a dozen times. Looks like a descending triangle.
BOSS:Except for that biiiiiig spike on Nov 08, it would look like higher high and higher lows, yet that spike makes me think if we would have got a hanging man in the yearly chart . Jokes apart, I see three tries at 1.2900 failing and the pair just making a lower low.
Worker: showing the effects of funky metals and rate hike in aud, has been making lower lows/lower highs since april. So I would conclude: a dontrend if choppy. Right now we're at that 1.2422 resistance and trying to break that spike of the 13th nov and just below trendline. HMMM
Plan A: would be to short here with a stop loss above 1.3000. agressive
Plan B: Short here with half position, the other half close to 1.3000 if seen
or further down on confirmation of down trend.
Plan C: Safest one maybe? Wait for PASR and break down.
Target: Initially the 1.2000 area and ideally 1.100 area if a bit ambitious and time consuming.
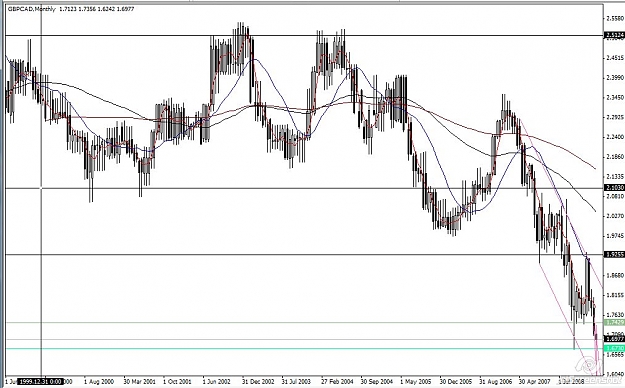
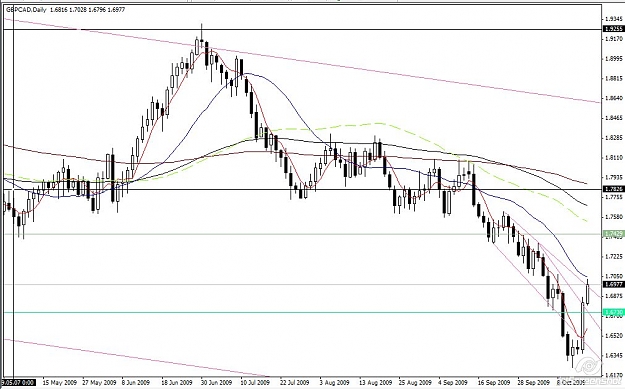
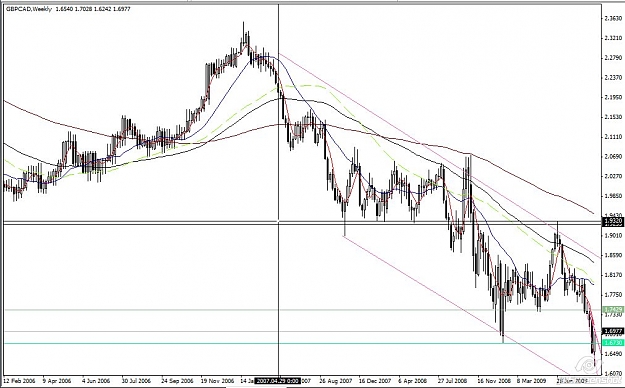
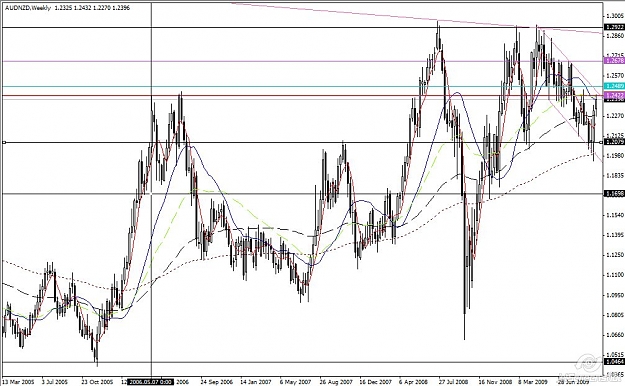
Have also been watching this powerful downtrend since it did the elastic bit on the daily on the 13th Nov.
Big Boss is giving us lower highs, lows since may 05 (2.5100).
Boss also doing the downtrend thing. Now in uncharted area.
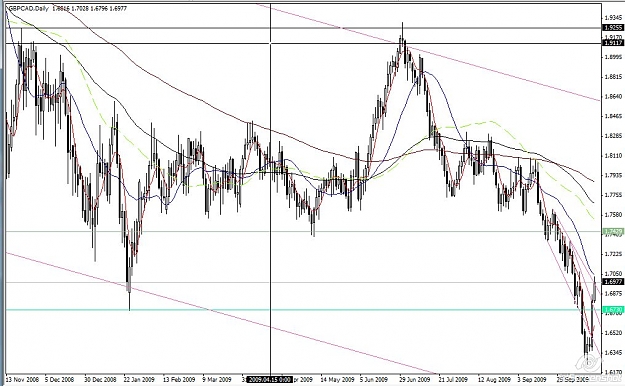
Worker not being a EW expert, seems to have down the 5 waves down from 15/9 and now would be finishing a wave A at minor Res. Mostly waves are difficult to see, yet some cases easy.
All in all, trend is down.
Again, it could have three plans A,B and C. In this case I favour plan C, wait and see PASR looking for a break down.
BIG BOSS and BOSS are bearish. Previous week was a high momentum bearish week, this week continued on the bearish path and was rejected by the powerful support zone at ~1.03 leaving behind a hammer.
While the hammer is a bullish sign especially considering its location I wouldn't look for any long positions considering the bearish momentum of the previous week.
Instead I am waiting to see if it gets back up to resistance at ~1.06 and there I will look for bearish patterns to get short.
P.S. Strat, or others, do you find high probability trading...
Ignored
P.S. Strat, or others, do you find high probability trading long considering the weekly hammer? I don't, but would like to know if others see things different... Just because there is a hammer or some form of reversal bar on the BOSS does not mean we switch teams and go long. It is an indication for those with short positions to take profit. The hammer is a mere indication that sentiment may be changing – we have to look for other signs to decide on future action. The change in sentiment may only be a short rally or it could move into a full blown trend change. There is nothing at this point to know how it will evolve. This is another reason to say SEE BEYOND THE CANDLES. For those on the first few steps of The Path, just because you see a price reversal bar at SR, does NOT mean you have to act on it. It is the FIRST indication the market gives us that sentiment, for the near term, MAY be changing. We have to carefully monitor the situation and look for other signs to confirm our actions.
Hi Strat may be eur gbp would help with the answer?
Ignored
So, on an INDICATOR FREE thread you are showing a chart with Ronald MacDonald’s wiggly line on, albeit in glorious red and green technicolour! Pray, please tell us how you use this wizardry to profit from EURGBP. Oh, I see it – “hidden divergence” – it’s made a higher hystericalogram against a supposedly lower price (which is NOT lower) and a lower hystericalogram bar and look, it’s turned red and red means DOWN! Wow, this really is a magic squiggly line – it can read that PRICE reached RESISTANCE but don’t tell anyone because it’s “hidden”” – only the secret few in Ronald MacDonald’s elite club know about this. Come on, wake up, look at PASR, you don’t need lagging, lying squiggly wiggly lines to tell you what the market is doing. It’s easy. Using our naked charts with our Mark I eyeball we see: PRICE reached RESISTANCE – a level of SUPPLY where SELLERS have sold at that PRICE previously. They then sold it down to a PRICE they had previously sold to before. For those new on The Path, it created a BEOB on the BOSS. While we don’t know for sure, we have a good idea where the SELLERS may stop for a rest – can Ronald tell you that?
Despite the teachings on this thread and our posts not to trade the Beast, it would appear that Cosmo has been savaged, ravaged and spit out in little pieces by The Beast. RIP
Ignored
Goodaye Strats, Just dropped bye to see how you guys are doing, savaged, ravaged & spit out.. not at all cobber... i've been learning a lot from another thread also based on trading the daily timeframe.. i'm obviously learning very little here based on my previous view on the direction of the GJ but based on what i have learnt since then, here is my current view, write this down, SELL GJ @ 148.00, TP 141.00... hang on for the ride guys!
Regards.. Glenn[/quote]
Goodaye Strats, Just dropped bye to see how you guys are doing, savaged, ravaged & spit out.. not at all cobber... i've been learning a lot from another thread also based on trading the daily timeframe.. i'm obviously learning very little here based on my previous view on the direction of the GJ but based on what i have learnt since then, here is my current view, write this down, SELL GJ @ 148.00, TP 141.00... hang on for the ride guys!
Regards.. Glenn Good on yer, swagman! I was hoping that would get your attention! i'm obviously learning very little here based on my previous view on the direction of the GJ Since others are learning and profiting so well from the teachings on this thread, might it be that the fault lies with the one doing the learning? Many of us on here profited nicely from the move from support to resistance where you naively went short. Many of us will also be profiting from the next move from resistance to support, however, since this is a Professional Educational thread, we teach traders how to analyse and find their own trades rather than going to threads which provide signals and trade directions. Something to do with a fish and fishing.
Have been looking at aud/nzd for a few weeks now.Thinking it may have got to the time of trying a trade here.
Big Boss: makes a setting for ranging down, lower highs and trying to break 1.0464 half a dozen times. Looks like a descending triangle.
BOSS:Except for that biiiiiig spike on Nov 08, it would look like higher high and higher lows, yet that spike makes me think if we would have got a hanging man in the yearly chart . Jokes apart, I see three tries at 1.2900 failing and the pair just making a lower low.
Worker: showing the effects of...
Ignored
Doesn't present any opportunities for me so I'm not wasting resources on it
Have also been watching this powerful downtrend since it did the elastic bit on the daily on the 13th Nov.
Big Boss is giving us lower highs, lows since may 05 (2.5100).
Boss also doing the downtrend thing. Now in uncharted area.
Worker not being a EW expert, seems to have down the 5 waves down from 15/9 and now would be finishing a wave A at minor Res. Mostly waves are difficult to see, yet some cases easy.
All in all, trend is down.
Again, it could have three plans A,B and C. In this case I favour plan C, wait and see...
Ignored
seems to have down the 5 waves down from 15/9 and now would be finishing a wave A at minor Res. Mostly waves are difficult to see, yet some cases easy. Since Wave 3 is supposed to be the longest and most profitable Impulse Wave, which is Wave 1? Then which is Wave 2? Hang on, which one is Wave 3? Then Wave 4 is usually the Mother of all EW corrections, so where is Wave 4? Damn, I can’t even see Wave 5. All I see is GBPCAD waving “goodbye” to those in long positions. No opportunities here for me yet so I’m OUT. I’ll give her another shufty when I see some PASR
Goodaye Strats, Just dropped bye to see how you guys are doing, savaged, ravaged & spit out.. not at all cobber... i've been learning a lot from another thread also based on trading the daily timeframe.. i'm obviously learning very little here based on my previous view on the direction of the GJ but based on what i have learnt since then, here is my current view, write this down, SELL GJ @ 148.00, TP 141.00... hang on for the ride guys!
Joined Nov 2007
|
Status: left CanaryWharf desk-tea break
|23,552 Posts
lol the macd is not the focal sorry for posting actually My trading is based on price action alone primarily and then I look for confluence,
Price did not go higher than the last high,
someone recommend me here
sorry to waste your time
So, on an INDICATOR FREE thread you are showing a chart with Ronald MacDonald’s wiggly line on, albeit in glorious red and green technicolour!
Pray, please tell us how you use this wizardry to profit from EURGBP.
Oh, I see it – “hidden divergence” – it’s made a higher hystericalogram against a supposedly lower price (which is NOT lower) and a lower hystericalogram bar and look, it’s turned red and red means DOWN!
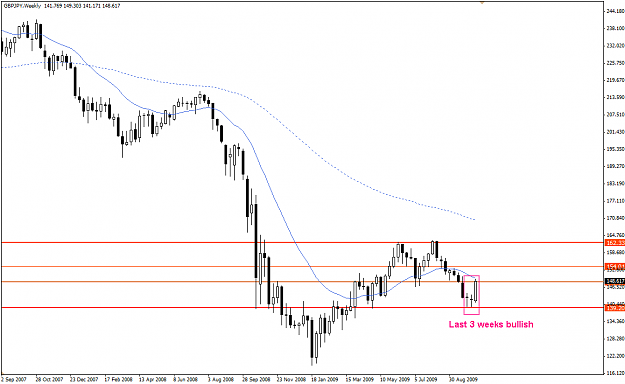
BOSS.
While BIG BOSS is bearish, last 3 bars on BOSS all show BUYING. The previous 2 hammers can be considered profit taking but last week ended up as a long bullish bar which means more buying strength.
Attached Image (click to enlarge)
Worker.
Big buying momentum visible on Worker too. Found resitance at 148.5, next resistance at 154, suport at 144. Am looking to long side if Ms. Market gives me chance and retraces to 144.
Attached Image (click to enlarge)
EDIT: It is GBPJPY, not USDJPY.
Trading = a mirror to your human flaws. Fix them or be fixed.
Hello all, I am back on the path of learning. You probably will not hear much from me for a while. I have a lot of catching up to do. Anyway, nice to see this thread is still active.
Hi Tony,
i think i must have recommended this Thread, and i know you are "PA and S/R " trader,i presume you forgot to take the Indicator Off from the chart before you posted....
|
Joined Sep 2009
|
Status: World's best weekend trader
|128 Posts
Strat wrote:
The Boss still shows a strong down trend. The 20 looks like nasty ski slope, however we just got a nice hammer suggesting it may be time to take break after testing the major 1.0300 level.
Good observation. Is it time for a trend change? Is it time for a re-test of that now very strong 1.0670 resistance? Or is now the time for a run back up to 1.0970? Or is it time just to tell the time? What do our history lessons tell us? Who is in control?
[ I'm really starting to appreciate what the weekly close can tell you!]
It is NOT just the BOSS close – please go back and re-read the Book of Revelations in The Path of Learning.
The 20 on the worker still suggests down but after a failed test of the 1.0300 level I will wait for a retrace to the 20 line and wait for PA to show the way.
See my earlier reply to soso on MAs. I get the impression from your post that you see the 20 as your Holy Grail. It is NOT and NEVER WILL BE. Sure, it looks great in a trending pair, but my one legged deaf, dumb and blind old man with asthma would also look good in a trending pair.
The MAs are there for a guide and as a trend trade management tool – NOTHING MORE – they should NEVER EVER be used in isolation and certainly not for justification of trades.
New traders to the method should learn how and why we use the MAs and then when they are firmly embedded in your trading sub-conscious, try to read PRICE ACTION without them. You should get to a point where you can “SEE” where they should be without them being on your charts.
SEE BEYOND THE CANDLES
Hello Strat,
I apologize for being vague in my post of my intensions, I don't see the 20 as trading signal and I realize its just another tool, I meant that I would look for price action at resistance which may be near the 20. As far as the weekly candle, I had a light bulb moment when I saw the hammer after watching the daily candles go up and down all week. For me it was similar to looking at the 5m and the stepping out to the 4hr. I am still working on seeing what story each candle has to tell.
I also got a nice lesson on the GU this week with the retrace to resistance. It have been easy to sell with the daily close below resistance but the previous candle told a different story. Fortunately this lesson didn't cost me anything.
Sometimes I feel a fool keeping my trigger finger in my pocket all the time especially in a nice trending market, but sometimes it works out just fine. I am still studying and listening, trying to absorb all the good info available here.
Thanks again for your time and efforts Strat and all the other great contributors here!
Poncho
" I can read the left side of the chart, the right side's a Bitch!