By identifying the key turning points X, A, B, C, and D, this indicator visually maps out harmonic formations on the chart using red and gray lines, helping traders isolate precise price reaction areas with high accuracy.
https://cdn.tradingfinder.com/file/4...5-by-tflab.zip
https://www.forexfactory.com/thread/...icator-for-mt4
https://www.forexfactory.com/thread/...-in-metatrader
Prop Firm DrawDown Protector : Prop Firm Capital Protection Expert MT5 | Forex Money Management: Forex Trade Management Expert MT5 | ICT Concepts Indicator MT5 |Smart Money Concepts Expert MT5 |Get a free Expert Advisor license via Telegram and WhatsApp
Key Features and Classification
The indicator integrates price behavior modeling with Fibonacci-based ratios to deliver precise reversal forecasts, particularly in low-volatility or range-bound markets.
Indicator Categories
- Price Action MT5 Indicators
- Harmonic MT5 Indicators
- Chart Pattern MT5 Tools
Supported Platform
- MetaTrader 5 (MT5)
User Skill Level
- Intermediate Traders
Indicator Type
- Reversal Indicator
Timeframe Compatibility
- Multi-Timeframe Support
Preferred Trading Styles
- Intraday Strategies
Market Applications
- Forex
- Cryptocurrencies
- Stocks
- Forwards
- Share CFDs
Functional Overview
The Classic Cypher Harmonic Pattern is a five-point geometric structure based on market symmetry and recurring price behavior. Each wave within the pattern is measured against Fibonacci ratios, with point D acting as the Potential Reversal Zone (PRZ).
This point serves as the most statistically likely area where the market may shift direction, offering a signal for entering long or short positions based on the overall trend context.
Bullish Reversal Example
In the 1-hour Gold vs. Oil chart, a bullish Cypher pattern is identified:
- Wave X to A reflects an initial upward movement.
- A temporary retracement takes the price to point B.
- Wave BC then extends above the high of point A.
- The price subsequently declines to point D, which becomes a support zone for a bullish reversal.
This structure offers a high-confidence Buy signal at point D.
Bearish Reversal Example
In the 15-minute XRP/USD chart, a bearish Cypher formation appears:
- The price initially drops from X to A, followed by a corrective bounce to point B.
- A strong bearish leg BC breaks below the low at point A.
- The price then rebounds to point D, where a bearish reversal is likely.
This structure marks the PRZ as a favorable Sell signal zone at point D.
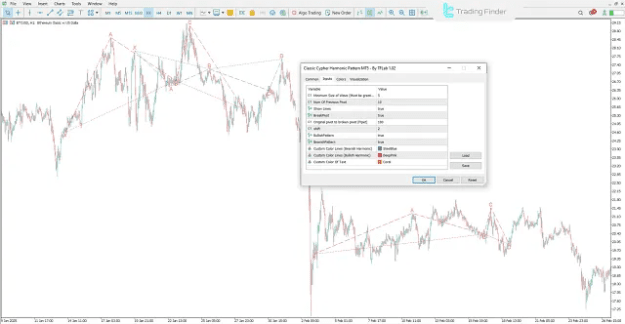
Indicator Settings and Customization
The Classic Cypher Harmonic Pattern Indicator offers extensive settings that allow users to tailor the visual presentation and detection sensitivity of the pattern.
Adjustable Parameters Include:
- Minimum Length of Wave (candles): Defines the minimum wave size required for detection
- Number of Previous Candles: Sets the historical range for scanning market patterns
- Show Lines: Toggles the visibility of harmonic structure lines
- BreakPivot Analysis: Enables detection of pivot breakout conditions
- Original to Broken Pivot Distance (Pipet): Adjusts breakout sensitivity in pipet units
- Line Shift: Controls horizontal positioning of drawn patterns
- Display Bullish Patterns: Activates visualization of bullish Cypher setups
- Display Bearish Patterns: Enables bearish pattern recognition
- Line Style and Width: Allows customization of line appearance
- Color Customization:
- Bullish and Bearish Line Colors
- Text Annotation Color on Chart
Conclusion
The Classic Cypher Harmonic Pattern Indicator for MT5 is a precision-based tool designed for detecting reversal zones using advanced Fibonacci relationships. It is particularly effective in sideways or consolidating markets where structured pattern recognition can provide early signals for market turns.
By visually highlighting key wave structures and emphasizing the D point as the likely reversal area, this indicator becomes a valuable asset for price action traders and pattern analysts operating within the MT5 environment.