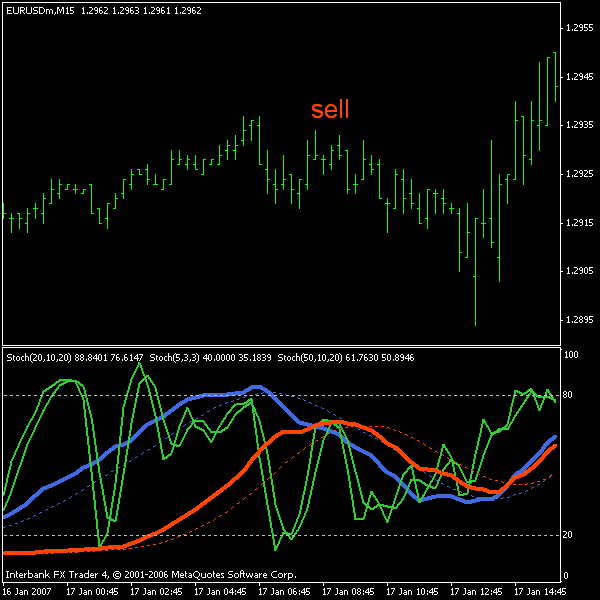
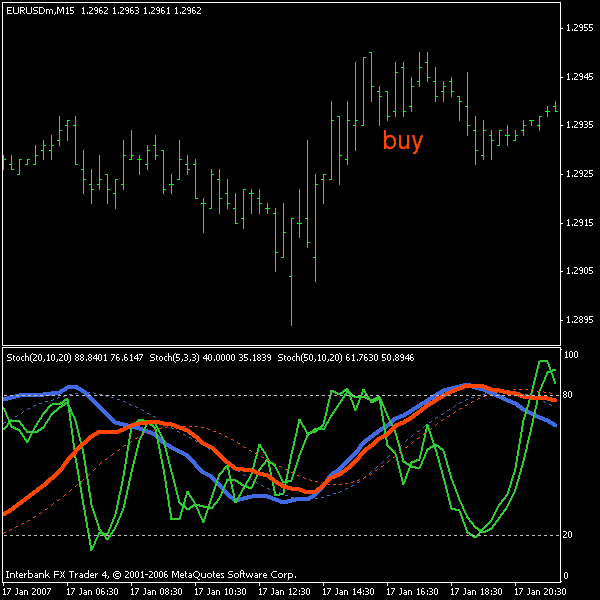
like most people ive made money lost money always lookin for somethin that works bla bla blaaaaa were all really tired of talkin about that arent we?
well finally "found" somethin its actually the slingshot system by buffy or i think its called "bline" and i made my own version which is slightly a bit different from his template.
this works on any timeframe really. but i prefer either scalping it on the 5 min or 15 or 1h maybe 4h.
money management? thats up to u. my stops are discretionary and i look at previous highs or go for 10-15 pips if im trading 5min or 15 min it really depends on alot of stuff. but im sorry i cant help u there since ive done very well on counting on my experience when it comes to stops. same with targets. at least aim for the same as the stop u use. plus this system was made for nasdaq and SnP and its deff different from fxxxxxxx.
but this is not gonna be too worrying because im only gonna write and show the best trades. no reason to over trade and no reason to enter a half assed trade or one ur not too sure off. only look for the best best trades so that ur stop can be tight and u can secure an easy 25-30 pips a day on the 5 or 15 min. i can almost assure u theres a perfect trade everyday.
the setup:
stochastics:
k:20
d:10
slowing:20
another stochastics in the same window. this one is longer term.
k:50
d:10
slowing:20
3rd stochastics in the same window. this one is for entry.
k:5
d:3
slowing:3
first indication: what u need to do is first look at the 20 and the 50 and see what they are doing. this is not necessary but when the 20 is above the 50 then thats my first hint the trend is up
when the 20 is below the 50 then trend is down.
sometimes they are really close to each other which should make u cautious about taking trades.
second indication: you want the 20 to be crossed down with its signal line and the 50 to be doing the same. if both are crossed down with their signal lines then price is trending down and we look to sell.
vice versa for when they are crossed up.
taking trades: when the 20 and the 50 have crossed their signal lines down we look at the 5. we want the 5 to go into overbought if the trend is down. basically we are looking for a pullback. as soon as the 5 cross back down we enter. if a nice tiny little consolidation formed and 20 and 50 are trending down and nicely then enter at that even if the 5 didnt make it very high.
vice versa when the 20 and 50 are trending up
the examples will clear up everything and ill be posting a few after im done with this post but im gonna add some remarks and then attach the first image.
remarks:
- the cross of the 20 and 50 is not so reliable. like an MA cross it can be tricky. but its good to look at because it can keep u away from bad trades.
- when the 20 cross its signal line, look at how steep its going up or down and also look at the space between the main line and the signal. the bigger the space the better the trade will be. same with the slope the steeper it is the better. this is stuff that after a few live and posted examples u will learn to see for yourself and ull know when its nice and trendy and when its being naughty.
- the 5 doesnt have to pull back all the way into oversold or overbought area. wait for a consolidation of price or for stochs to cross then enter. in a strong trend u can easily see when price stalls before continuing.
- im awesome
- if i can think of anything else ill deff add.
- o yea.
perfect long trade:
20 cross the 50 up.
20 and 50 both crossed their signal line up and are slopped nicely
5 pulls back all the way into oversold while price is stalling and consolidating.
- also try adding a 9 ema and a 34 ema (i like the fibo numbers) and when ur about to take a trade check if the 9 crossed the 34 up if ur taking a long trade or down if its a short. this is really just extra confirmation. i dont personally use it unless im really really bored.
ok. u know feel free to add anything and i dont take all the credit but a bit of it for my variations.
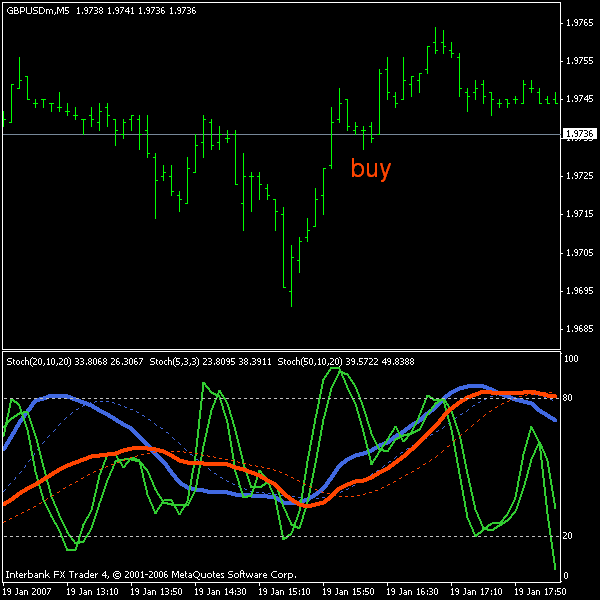
ok first chart
the 20 is crossed up with the 50. they have both crossed their signal lines and are moving up nicely. the 5 didnt go all the way down but price consolidated. i would enter at the bar right after the one with the low. basically telling me price isnt going any lower. i wait for it to close then i enter. this is a bit discretionary but thats how i do things. i look for little confirmations. another one is that star looking bar with the low. it has a name the open is the same as the close and it shows indecision so thats another small confirmation..
ok more to come next. stay tuned
Attached Image
