• Home
  • Forums
  • Trades
  • News
  • Calendar
  • Market
  • Brokers
  • Login
  • Join
  • User/Email: Password:
  • 7:01am
Menu
  • Forums
  • Trades
  • News
  • Calendar
  • Market
  • Brokers
  • Login
  • Join
  • 7:01am
Sister Sites
  • Metals Mine
  • Energy EXCH
  • Crypto Craft

Options

Bookmark Thread

First Page First Unread Last Page Last Post

Print Thread

Similar Threads

Naked Trading Using Price Action (No Indicators) 32 replies

Naked trading - reading charts 12 replies

Trade Naked Candlesticks strategy 15 replies

Naked Candlesticks 10 replies

Reading......and reading....... 21 replies

  • Trading Discussion
  • /
  • Reply to Thread
  • Subscribe
  • 54
Attachments: Trading Naked - Reading Candlesticks and other Price Analysis
Exit Attachments

Trading Naked - Reading Candlesticks and other Price Analysis

  • Last Post
  •  
  • Page 1 23456 8
  • Page 1 234 8
  •  
  • Post #1
  • Quote
  • First Post: Jan 20, 2007 11:50am Jan 20, 2007 11:50am
  •  Daemien
  • | Joined May 2006 | Status: The Number of the Beast! | 395 Posts
Hello Everybody!

There have been a lot of questions & interest surrounding candlesticks & other chart patterns recently. I am by no means an expert, but some of the recent threads have refuelled my interest in these 'naked' chart indicators. I studied & paper traded candlesticks with stocks many years ago (10+) and have spent a lot of time these past few weeks refreshing my theory.

The intent of this thread is for an in-depth discussion & analysis of these types of naked indicators. There is a lot of information out there and I feel that sharing what we know will not only help others, but can only strengthen the journey to enlightenment in ourselves.

I will start this out with a few historical examples in the next post!

Happy Trading!

Daemien
  • Post #2
  • Quote
  • Jan 20, 2007 12:02pm Jan 20, 2007 12:02pm
  •  JodyOng
  • Joined Jul 2006 | Status: I'm lovin it | 427 Posts
Good to see you here Daemien! I've read through your site and alot of the information there has benefited me in many ways. Looking forward to discussing price action in depth with you.
 
 
  • Post #3
  • Quote
  • Jan 20, 2007 12:18pm Jan 20, 2007 12:18pm
  •  Daemien
  • | Joined May 2006 | Status: The Number of the Beast! | 395 Posts
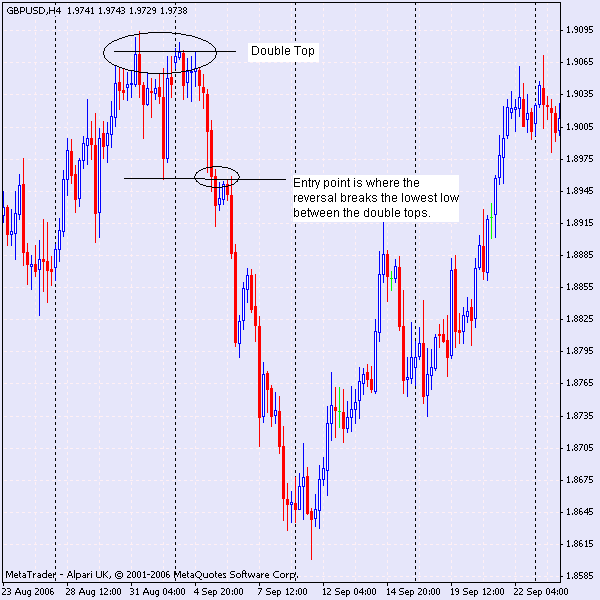
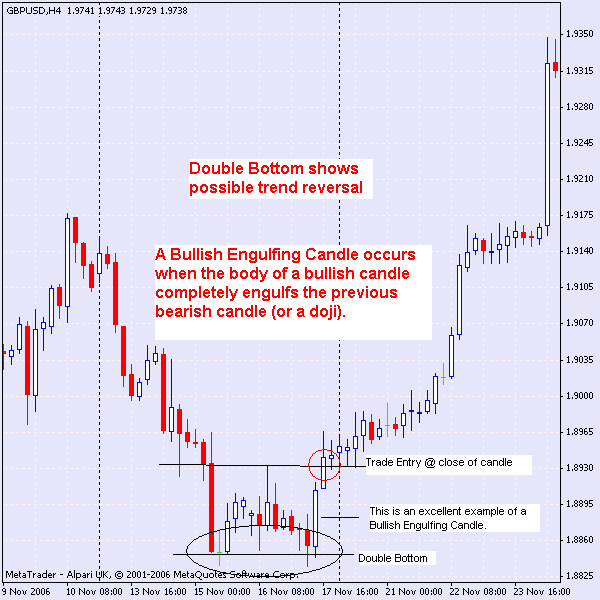
Double tops & bottoms are a great reversal indicator.

They are comprised of a bounce off of support or resistance, followed by a second bounce - these form two distinct highs or lows on a chart. A double top is a reversal pattern of a bullish trend - a double bottom is a reversal pattern of a bearish trend. The time in between bounces is directly proportional to it's strength, ie: The longer the time between, the greater the chance of a strong reversal.
Position is entered after the highest high or highest low inside the formation is broken.

The following charts show examples of both double tops & double bottoms. I have also pointed out some other formations that we can discuss in a future post.

Good luck in all of your trades!

D.
Attached Images
 
 
  • Post #4
  • Quote
  • Jan 20, 2007 12:22pm Jan 20, 2007 12:22pm
  •  Daemien
  • | Joined May 2006 | Status: The Number of the Beast! | 395 Posts
Actually, how do you get pictures to display within the actual message?

Thanks,

D.


Quoting Daemien
Disliked
Double tops & bottoms are a great reversal indicator.

<snip>

D.
Ignored
 
 
  • Post #5
  • Quote
  • Jan 20, 2007 12:29pm Jan 20, 2007 12:29pm
  •  Bemac
  • Joined Jan 2006 | Status: Monarch o' the Glen | 5,561 Posts
Quoting Daemien
Disliked
Actually, how do you get pictures to display within the actual message?

Thanks,

D.

Ignored
Attach only One per post.
 
 
  • Post #6
  • Quote
  • Jan 20, 2007 1:16pm Jan 20, 2007 1:16pm
  •  Daemien
  • | Joined May 2006 | Status: The Number of the Beast! | 395 Posts
Hi Jody,

Thanks for the vote of confidence, but I think you may be confusing me for somebody else. Is there another Daemien out there?? Hmm... my wife would be most distressed to find this out (she can only handle one )

Take care & I look forward to a great discussion!

D.

Quoting JodyOng
Disliked
Good to see you here Daemien! I've read through your site and alot of the information there has benefited me in many ways. Looking forward to discussing price action in depth with you.
Ignored
 
 
  • Post #7
  • Quote
  • Jan 20, 2007 1:18pm Jan 20, 2007 1:18pm
  •  kenmania
  • | Joined Sep 2006 | Status: Rookie Microcosmic Trader | 461 Posts
Quoting Daemien
Disliked
Actually, how do you get pictures to display within the actual message?

Thanks,

D.

Ignored
I think the only way to do it is to upload them to a hosting service like photobucket.com or imageshack.us. Then use the "insert image" button (has little mountains on it) located on the post menu to insert the link to your image.

Don't forget the maximum image size on the forum is 600 x 600.

(Sorry- I edited to add that)
Is your SL my TP?
 
 
  • Post #8
  • Quote
  • Jan 20, 2007 1:25pm Jan 20, 2007 1:25pm
  •  athalon7
  • | Joined Oct 2006 | Status: I Hedge | 206 Posts
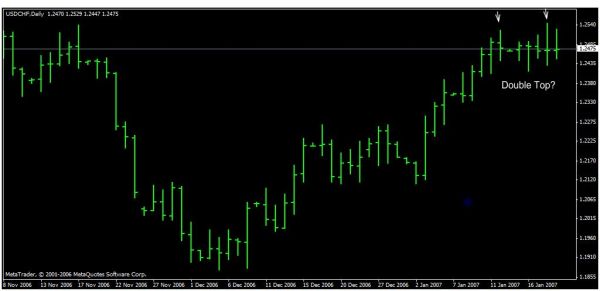
Ok- I am trading the Swiss right now and looking for a reversal of the current upswing. All things aside from the fundamental aspect, is this a double top?
Attached Image
"Its not where your at, but where your coming from"
 
 
  • Post #9
  • Quote
  • Jan 20, 2007 3:00pm Jan 20, 2007 3:00pm
  •  Dopey
  • Joined Apr 2005 | Status: Dopey Bastard | 1,568 Posts
If you get a reversal bar, then play it as such.
 
 
  • Post #10
  • Quote
  • Jan 20, 2007 4:14pm Jan 20, 2007 4:14pm
  •  Daemien
  • | Joined May 2006 | Status: The Number of the Beast! | 395 Posts
Hi Athalon,

This could very well be a double top. If you'll notice, the second bar from the right has the same open and close price. This is known as a Doji in candlesticks which by itself signifies indecision (buyers and sellers are in balance). If you get some downward movement, wait until it penetrates below the low which is between your two 'double tops' before you place your entry.

Good luck!

Daemien

Quoting athalon7
Disliked
Ok- I am trading the Swiss right now and looking for a reversal of the current upswing. All things aside from the fundamental aspect, is this a double top?
Ignored
 
 
  • Post #11
  • Quote
  • Jan 20, 2007 4:16pm Jan 20, 2007 4:16pm
  •  Daemien
  • | Joined May 2006 | Status: The Number of the Beast! | 395 Posts
Hi Ken,

Thanks for the tip! I think I'll stick to one photo per post - that should do it!

Take care,

D.

Quoting kenmania
Disliked
I think the only way to do it is to upload them to a hosting service like photobucket.com or imageshack.us. Then use the "insert image" button (has little mountains on it) located on the post menu to insert the link to your image.

Don't forget the maximum image size on the forum is 600 x 600.

(Sorry- I edited to add that)
Ignored
 
 
  • Post #12
  • Quote
  • Edited at 6:21pm Jan 20, 2007 4:31pm | Edited at 6:21pm
  •  Daemien
  • | Joined May 2006 | Status: The Number of the Beast! | 395 Posts
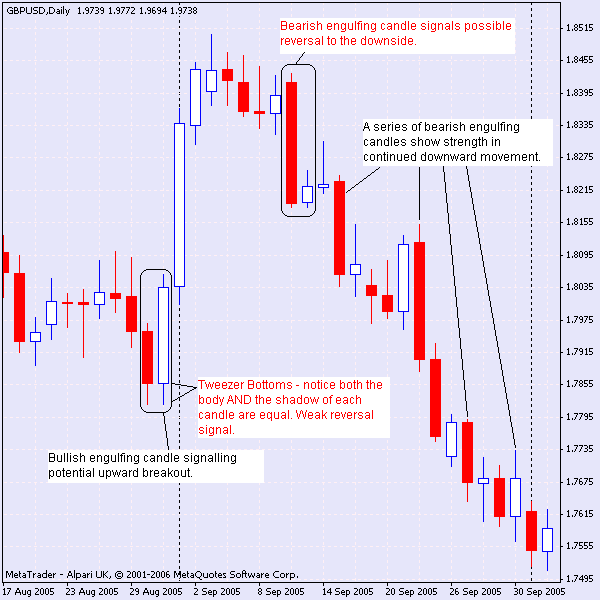
Two more candlestick patterns to be aware of:

Engulfing patterns are two candle patterns indicating a strong chance of reversal. This is one of the major patterns to look for in candlestick trading.

A Bullish Engulfing pattern occurs during a down (bearish) trend. The first candle in the pattern is bearish. The second is bullish, opening below or equal to the close of the previous candle. It will close above the open of the previous candle. In essence, the body of the bullish candle 'engulfs' or 'is bigger than' the body of the previous bear.

A Bearish Engulfing pattern is the exact opposite occurring during an upward (bullish) trend. The first candle in the pattern is bullish. The second is bearish, opening above or equal to the close of the previous candle. It will close below the open of the previous candle 'engulfing' the bull.

In both of these, the shadows do not come into play. It is solely the body of the candle we are concerned with.

In either case, if the engulfing candle engulfs more than one of the previous candles of the opposite trend, this adds strength to the signal.


Tweezer Tops & Bottoms are a two candle pattern. The strength of this particular pattern is quite weak, so make sure it is confirmed with other action.

A tweezer top occurs during an upward trend. The first candle is bullish, and the second candle is bearish. The tops are at the same level - this could be either the tops of the shadows or the tops of the real bodies or both. They do not have to be exact, but should be within a few pips of one another.

A tweezer bottom occurs during a downward trend. The first candle is bearish, and the second is bulish. The bottoms are at the same level - again this could be either the tops of the shadows, the real bodies or both that are at the same level.

Again, this particular signal should definitely be confirmed with another showing the same possible reversal before acting on it.

Examples in the attached chart!

Happy pippin'!

D.

Addendum: I just realized I made a mistake in the chart below. The first bearish engulfing candle should include the small bullish candle to the left, not the right.
Attached Image
 
 
  • Post #13
  • Quote
  • Edited Mar 3, 2007 3:58pm Jan 20, 2007 5:18pm | Edited Mar 3, 2007 3:58pm
  •  ghitz
  • | Joined Sep 2006 | Status: Member | 132 Posts
Quoting athalon7
Disliked
Ok- I am trading the Swiss right now and looking for a reversal of the current upswing. All things aside from the fundamental aspect, is this a double top?
Ignored
have a look at your weekly chart. doji at trendline. my guess is you get a down move to 2370, then assess price there. that should be support. afterthat, move up.

my 2 cents.
With a break always expect a pullback, otherwise, you're dead meat/
 
 
  • Post #14
  • Quote
  • Edited Mar 3, 2007 3:58pm Jan 20, 2007 5:29pm | Edited Mar 3, 2007 3:58pm
  •  ghitz
  • | Joined Sep 2006 | Status: Member | 132 Posts
Quoting ghitz
Disliked
have a look at your weekly chart. doji at trendline. my guess is you get a down move to 2370, then assess price there. that should be support. afterthat, move up.

my 2 cents.
Ignored
and a 4 hr chart

err, i used to trade naked. now i just wear underpants. lol.
With a break always expect a pullback, otherwise, you're dead meat/
 
 
  • Post #15
  • Quote
  • Jan 20, 2007 5:30pm Jan 20, 2007 5:30pm
  •  steviet
  • Joined Jun 2006 | Status: Member | 2,512 Posts
Quoting Daemien
Disliked
Double tops & bottoms are a great reversal indicator.

They are comprised of a bounce off of support or resistance, followed by a second bounce - these form two distinct highs or lows on a chart. A double top is a reversal pattern of a bullish trend - a double bottom is a reversal pattern of a bearish trend. The time in between bounces is directly proportional to it's strength, ie: The longer the time between, the greater the chance of a strong reversal.
Position is entered after the highest high or highest low inside the formation is broken.

The following charts show examples of both double tops & double bottoms. I have also pointed out some other formations that we can discuss in a future post.

Good luck in all of your trades!

D.
Ignored
Hey Damien,

Great thread

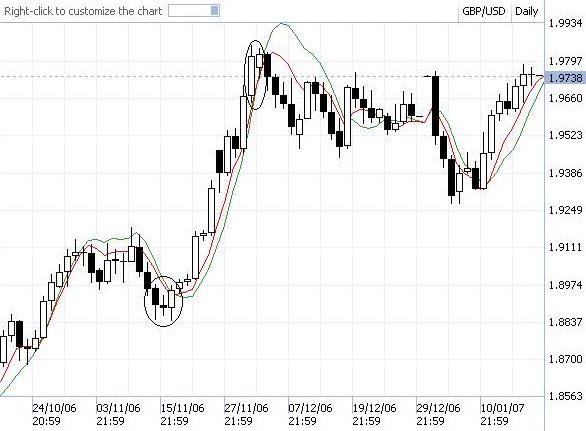
Saw your first example of a double bottom on the 4 hour chart for GU and thought I'd attach a daily chart from the same time. You will see that the same period translated to a doji on the daily followed by a confirmation bullish engulfing bar. The trade ran all the way for over 700 pips until we see a double top nearly two weeks later. I remember that particular trade well

Some really great comments here - keep them coming folks!

Kind Regards
Steve
Attached Image
 
 
  • Post #16
  • Quote
  • Jan 20, 2007 5:33pm Jan 20, 2007 5:33pm
  •  ghitz
  • | Joined Sep 2006 | Status: Member | 132 Posts
Quoting steviet
Disliked
Hey Damien,

Great thread

Saw your first example of a double bottom on the 4 hour chart for GU and thought I'd attach a daily chart from the same time. You will see that the same period translated to a doji on the daily followed by a confirmation bullish engulfing bar. The trade ran all the way for over 700 pips until we see a double top nearly two weeks later. I remember that particular trade well

Some really great comments here - keep them coming folks!

Kind Regards
Steve
Ignored
and to the benefit of the setup, that was 50% fib of the move up 85xx to 9170ish.

yep, remember that one very well.
With a break always expect a pullback, otherwise, you're dead meat/
 
 
  • Post #17
  • Quote
  • Jan 20, 2007 6:25pm Jan 20, 2007 6:25pm
  •  Daemien
  • | Joined May 2006 | Status: The Number of the Beast! | 395 Posts
lol

Depends for me!

D.

Quoting ghitz
Disliked
and a 4 hr chart

err, i used to trade naked. now i just wear underpants. lol.
Ignored
 
 
  • Post #18
  • Quote
  • Jan 20, 2007 6:28pm Jan 20, 2007 6:28pm
  •  Daemien
  • | Joined May 2006 | Status: The Number of the Beast! | 395 Posts
Thanks Steve,

Heck, you were the catalyst lol

As for your trade setup... as they say, sweeeeeeet! Wish I'd been around to catch that one!

That's another way to confirm action for sure - check a different time frame for confirmation. Sounds like this was the perfect setup!

Take care,

D.


Quoting steviet
Disliked
Hey Damien,

Great thread

Saw your first example of a double bottom on the 4 hour chart for GU and thought I'd attach a daily chart from the same time. You will see that the same period translated to a doji on the daily followed by a confirmation bullish engulfing bar. The trade ran all the way for over 700 pips until we see a double top nearly two weeks later. I remember that particular trade well

Some really great comments here - keep them coming folks!

Kind Regards
Steve
Ignored
 
 
  • Post #19
  • Quote
  • Jan 20, 2007 6:31pm Jan 20, 2007 6:31pm
  •  dof
  • | Joined Mar 2006 | Status: Member | 447 Posts
I remember that double bottom on the 4h GBPUSD and morning star on daily. It was also some fib there. I didn't trade it because it was around thanksgiving, but i took a long long look.
Anyway, great thread.
Try hard, think fast, die young
 
 
  • Post #20
  • Quote
  • Jan 20, 2007 6:34pm Jan 20, 2007 6:34pm
  •  athalon7
  • | Joined Oct 2006 | Status: I Hedge | 206 Posts
Yeah- This is a good post and I appreciate the input. My very humble opinion is candlesticks are the cornerstone to any good trading strategy. I hope the Swiss moves down at least a hundred pips next week.
"Its not where your at, but where your coming from"
 
 
  • Trading Discussion
  • /
  • Trading Naked - Reading Candlesticks and other Price Analysis
  • Reply to Thread
    • Page 1 23456 8
    • Page 1 234 8
0 traders viewing now
  • More
Top of Page
  • Facebook
  • Twitter
About FF
  • Mission
  • Products
  • User Guide
  • Media Kit
  • Blog
  • Contact
FF Products
  • Forums
  • Trades
  • Calendar
  • News
  • Market
  • Brokers
  • Trade Explorer
FF Website
  • Homepage
  • Search
  • Members
  • Report a Bug
Follow FF
  • Facebook
  • Twitter

FF Sister Sites:

  • Metals Mine
  • Energy EXCH
  • Crypto Craft

Forex Factory® is a brand of Fair Economy, Inc.

Terms of Service / ©2022