This is an old strategy from the famous larry... just used on H4 instead D1!
A buy signal is given when: The market price is above the 200-day moving average. The 2-period RSI is falling for three days in a row. On the first candle of the three-candle decline, the RSI value is already below 60. Actual 2-period RSI is closing below 10.
A short sell signal is given when: The market price is below the 200-day moving average. The 2-period RSI is rising for three candle in a row. On the first candle of the three-candle rise, the RSI value is already above 40. Actual 2-period RSI is closing above 90.
I know it s only for daily charts... but I want to get some signals so I choose a TF one step lower!
Original source:
https://www.whselfinvest.de/de-de/tr...-larry-connors
Best pairs here:
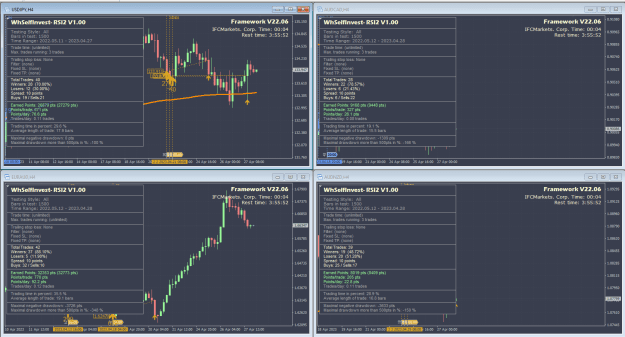
Attached Image (click to enlarge)
Vucking good EA coder... https://t.ly/AZjRM