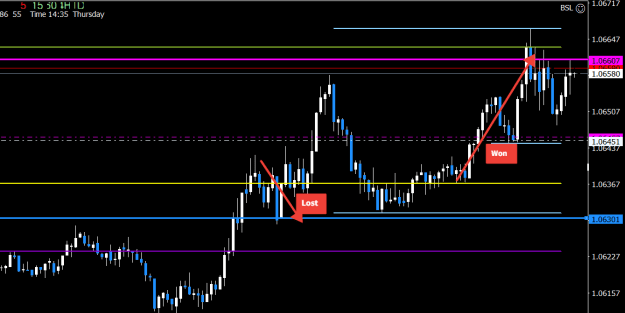
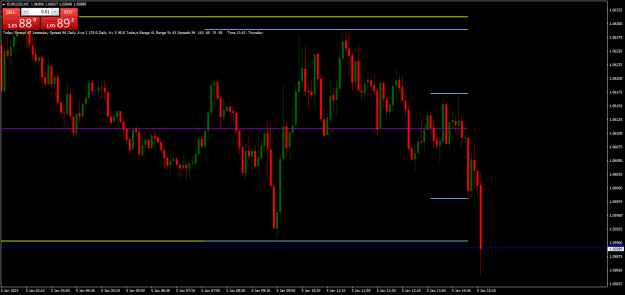
I think this is a great and simple approach to trading. Have you considered adding Fair Value Gaps to your analysis? I have a feeling it will make things a lot better. Here's an image of a possible Asian Range High rejection trade using FVG using a broken structure level as an entry. {image}
Ignored
Fair Value Gaps..... Not sure exactly what you mean by fair value gaps, but no, for me, the more things, the more confusing it gets
Round numbers, again no... I go for the expansion of the Asian levels, again if I look at long numbers, it's more to think about.
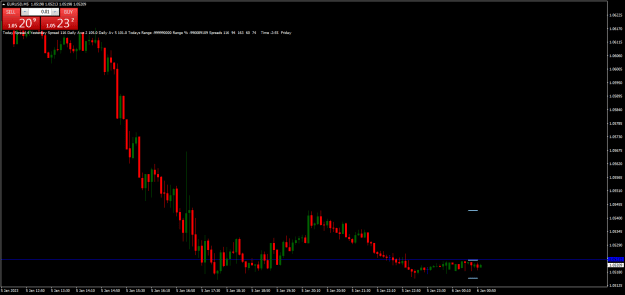
First trade today, it's just not right, I enter a trades too early after getting up, without taking time to think it through properyl, 2nd trade - happy days, it's little, but it's profit.
thanks for sharing this interesting idea. Looking forward to tonyour new posts …. Personally I have done some visual backedtinh on the major pairs but has been difficult to spot the pattern….
maybe you can share some live trades this week to make it more clear .
Happy new year
Hello sir, thanks for sharing this interesting idea. Looking forward to tonyour new posts …. Personally I have done some visual backedtinh on the major pairs but has been difficult to spot the pattern…. maybe you can share some live trades this week to make it more clear . Happy new year
Ignored
Stick to EU to learn, before venturing to other pairs.
I will post some live, but you can load the indicator and run on strategy tester, it's a great excersise to do.
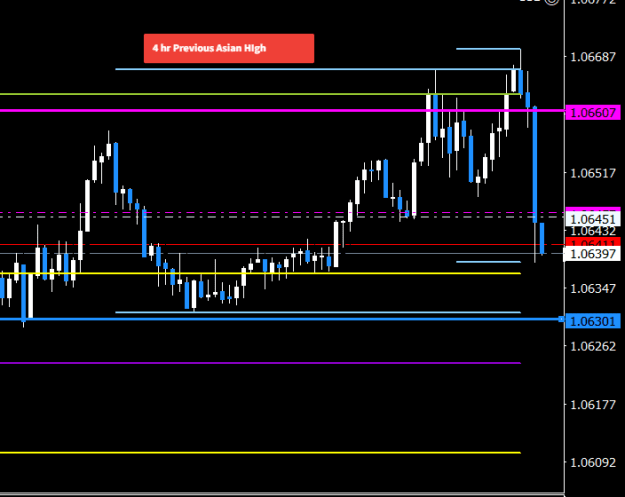
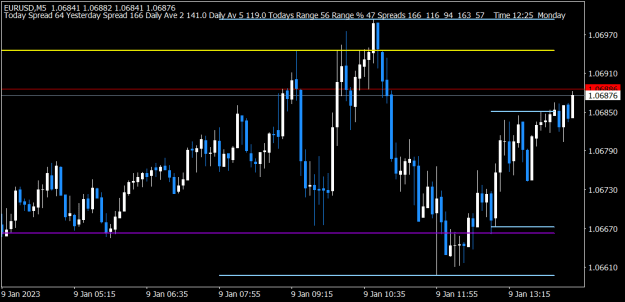
The purple line is half way between the top of the Asian High and Low, then the yellow lines above and below them are simply the same distance in steps as the distance between the high and low, then you have the last 4hr high and low in light blue, and also the 1hr which is the shorter one.
I will do a chart with full explanation in the next couple of days.
The purple line is half way between the top of the Asian High and Low, then the yellow lines above and below them are simply the same distance in steps as the distance between the high and low, then you have the last 4hr high and low in light blue, and also the 1hr which is the shorter one. I will do a chart with full explanation in the next couple of days.
{quote} Stick to EU to learn, before venturing to other pairs. I will post some live, but you can load the indicator and run on strategy tester, it's a great excersise to do. I attach the latest version.{file} .
Ignored
hi in what folder put it?
ONLY AN IDIOT ASK FOR 2 YEARS EXPERIENCE TO TRADE ANY SYSTEM