I have decided to start a new thread on this topic as I couldn't find another one where my approach fits and I didn't want to cause confusion by posting about my strategy on other people's threads. I posted the below yesterday on Phillip Nel's 5 Min Intraday System (https://www.forexfactory.com/thread/...ntraday-system), hence my reference to Phillip, but then realised he is in the Commercial section, so I'm starting again here under Trading Systems.
==================
I have been a member of FF since 2017, but decided to change my nickname to my real name, so I'm back to being a newbie!
I've been looking for a suitable thread to post my work in and Phillip Nel's work, at least in the earlier pages, is as close as I could find to mine, so it feels right here. But his work is widely respected so I don't really want to get in the way of that. I hope what I post adds value. And as Phillip is a fellow South African, it feels even more like home! Phillip, if you read this, Groete!
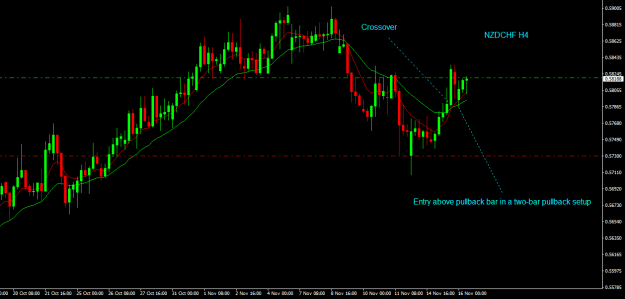
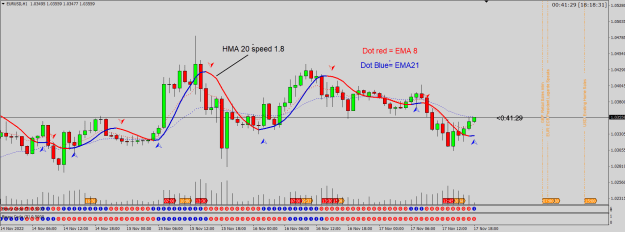
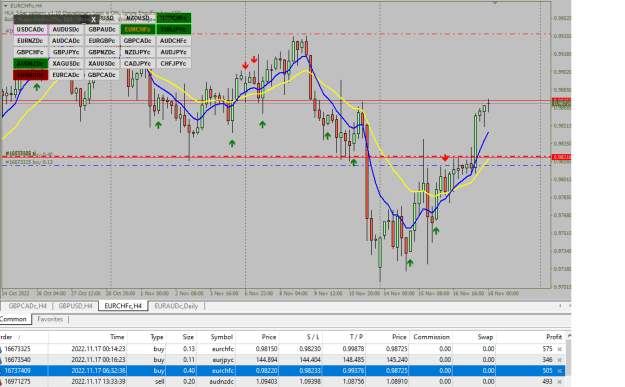
I use an 8/21 EMA strategy. There is nothing special about those two numbers. No magic. You could use Phillip's 10/21 EMAs or 10/25 or 6/15, or 12/35, whatever. But I did not suggest 50/200. Smaller MA numbers means the MAs never get very far from price and there is a reason for that - it gives a visual reference for price behaviour, you can judge almost up to the minute how stretched price is from the MAs and whether it is more likely to undergo a correction (reversion to the mean) or to break away from the mean.
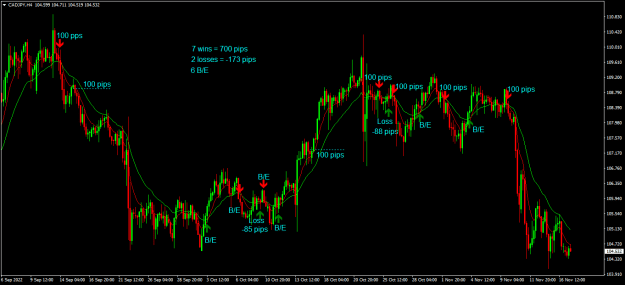
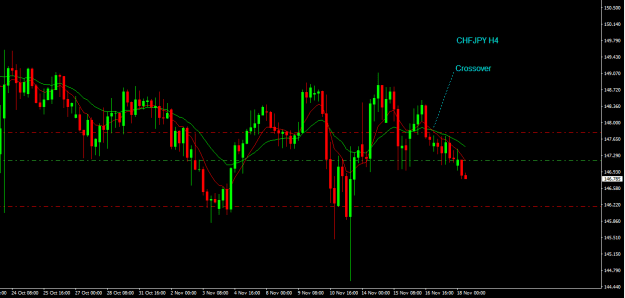
This chart summarises my strategy. I wait for a new trend to form, as defined by the EMA crossover, then wait for a pullback to (or close to) the EMAs, which I have now discovered is similar to what Phillip teaches, and then enter a trade. I almost always use stop orders so that if a pullback turns into a reversal, there is less chance of that trade being taken out as price continues the 'wrong' way. Note that I identified a two-bar pullback setup and two inside bar setups. They all represent a pullback, or at least a pause, or a local consolidation period. And after the multi-IB setup, price exploded away. That's just perfect. I look for that kind of setup all the time.

==================
I have been a member of FF since 2017, but decided to change my nickname to my real name, so I'm back to being a newbie!
I've been looking for a suitable thread to post my work in and Phillip Nel's work, at least in the earlier pages, is as close as I could find to mine, so it feels right here. But his work is widely respected so I don't really want to get in the way of that. I hope what I post adds value. And as Phillip is a fellow South African, it feels even more like home! Phillip, if you read this, Groete!
I use an 8/21 EMA strategy. There is nothing special about those two numbers. No magic. You could use Phillip's 10/21 EMAs or 10/25 or 6/15, or 12/35, whatever. But I did not suggest 50/200. Smaller MA numbers means the MAs never get very far from price and there is a reason for that - it gives a visual reference for price behaviour, you can judge almost up to the minute how stretched price is from the MAs and whether it is more likely to undergo a correction (reversion to the mean) or to break away from the mean.
This chart summarises my strategy. I wait for a new trend to form, as defined by the EMA crossover, then wait for a pullback to (or close to) the EMAs, which I have now discovered is similar to what Phillip teaches, and then enter a trade. I almost always use stop orders so that if a pullback turns into a reversal, there is less chance of that trade being taken out as price continues the 'wrong' way. Note that I identified a two-bar pullback setup and two inside bar setups. They all represent a pullback, or at least a pause, or a local consolidation period. And after the multi-IB setup, price exploded away. That's just perfect. I look for that kind of setup all the time.
Attached Image (click to enlarge)