• Home
  • Forums
  • Trades
  • News
  • Calendar
  • Market
  • Brokers
  • Login
  • Join
  • User/Email: Password:
  • 8:38pm
Menu
  • Forums
  • Trades
  • News
  • Calendar
  • Market
  • Brokers
  • Login
  • Join
  • 8:38pm
Sister Sites
  • Metals Mine
  • Energy EXCH
  • Crypto Craft

Options

Bookmark Thread

First Page First Unread Last Page Last Post

Print Thread

Similar Threads

Volman Style (70-tick chart) 393 replies

The Dissent Channel: Volman Price Action 30 replies

Understanding Price Action by Bob Volman (notes and examples) 96 replies

Bob Volman & TMT System 16 replies

pls share your journey 10 replies

  • Trading Journals
  • /
  • Reply to Thread
  • Subscribe
  • 799
Attachments: Volman meets Burke or My journey with PA
Exit Attachments
Tags: Volman meets Burke or My journey with PA
Cancel

Volman meets Burke or My journey with PA

  • Last Post
  •  
  • 1 7980Page 818283 109
  • 1 Page 81 109
  •  
  • Post #1,601
  • Quote
  • Jan 30, 2023 11:34am Jan 30, 2023 11:34am
  •  spzd
  • Joined Dec 2010 | Status: Hybrid PA | 3,470 Posts | Online Now
Piddling with the FX. The GJ likes to do larger balance/reset moves. And me, I tend to keep a tighter SL. Results do not mix.

Brought up the EU. Like all instruments I have put this framework on it fits. Much slower in the move department.
Mark ... Either you understand or you don't, and that is that.
 
1
  • Post #1,602
  • Quote
  • Jan 31, 2023 6:08pm Jan 31, 2023 6:08pm
  •  spzd
  • Joined Dec 2010 | Status: Hybrid PA | 3,470 Posts | Online Now
After a couple of days, even with the smaller volatility, I have evaluated the 15-period and have decided to go back to the 20-period and focus on m5 for my main trading chart. Enough is enough. I do think the M1 chart may be my kryptonite. As far as the Hull period, I went through my old notes (from many years ago) and found a flaw in my reasoning for the 15-period over the 20-period.
Mark ... Either you understand or you don't, and that is that.
 
 
  • Post #1,603
  • Quote
  • Feb 1, 2023 2:35pm Feb 1, 2023 2:35pm
  •  spzd
  • Joined Dec 2010 | Status: Hybrid PA | 3,470 Posts | Online Now
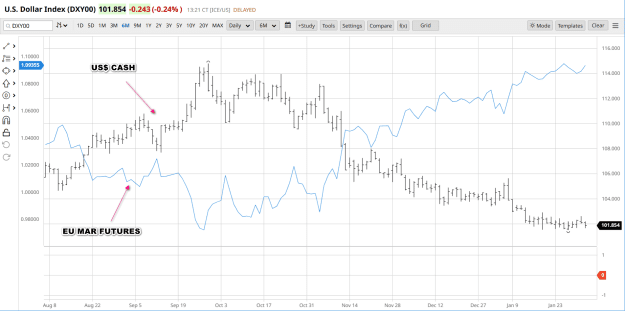
Pet Peeve - The DXY

The DXY is virtually useless unless you trade the futures or cfd. Then just go opposite the EU. Since the DXY is essentially the inverse of the EU.

Push it aside already, it's a useless comparison ...


Attached Image (click to enlarge)
Click to Enlarge

Name: DXYvEU.png
Size: 61 KB
Mark ... Either you understand or you don't, and that is that.
 
1
  • Post #1,604
  • Quote
  • Feb 1, 2023 2:45pm Feb 1, 2023 2:45pm
  •  spzd
  • Joined Dec 2010 | Status: Hybrid PA | 3,470 Posts | Online Now
So yeah, I know a bit more than I let on, but why bother spewing info that is really useless. I am finalizing a simple method that, when traded correctly, will be very profitable, I have no doubts. Alas. I am my own worst enemy ...
Mark ... Either you understand or you don't, and that is that.
 
2
  • Post #1,605
  • Quote
  • Feb 1, 2023 5:25pm Feb 1, 2023 5:25pm
  •  spzd
  • Joined Dec 2010 | Status: Hybrid PA | 3,470 Posts | Online Now
Going to read Volman again. With many months to my back and being set for now, I think it is time to revisit those who got me here in the first place.
Mark ... Either you understand or you don't, and that is that.
 
1
  • Post #1,606
  • Quote
  • Feb 2, 2023 5:39pm Feb 2, 2023 5:39pm
  •  spzd
  • Joined Dec 2010 | Status: Hybrid PA | 3,470 Posts | Online Now
Quoting OAPDave
Disliked
Hi Might interest you ? {image}
Ignored

Thanks not anywhere near as in depth as what you have going.

M5 is 20, 60, 240 for m5, M15, H1

Attached Image (click to enlarge)
Click to Enlarge

Name: W5-D4-@MESM5.png
Size: 32 KB
Mark ... Either you understand or you don't, and that is that.
 
 
  • Post #1,607
  • Quote
  • Feb 2, 2023 5:44pm Feb 2, 2023 5:44pm
  •  spzd
  • Joined Dec 2010 | Status: Hybrid PA | 3,470 Posts | Online Now
More precisely

Attached Image (click to enlarge)
Click to Enlarge

Name: 2023-02-02_164314.png
Size: 35 KB
Mark ... Either you understand or you don't, and that is that.
 
 
  • Post #1,608
  • Quote
  • Feb 2, 2023 6:36pm Feb 2, 2023 6:36pm
  •  spzd
  • Joined Dec 2010 | Status: Hybrid PA | 3,470 Posts | Online Now
Quoting OAPDave
Disliked
{quote} If you want a 15min chart of anything to compare just tell me the length of the HULLS you want adding {image} {image}
Ignored
Interesting. I am going to stay back from this for now. Working on a couple other nuts. I may return before too long.
Mark ... Either you understand or you don't, and that is that.
 
 
  • Post #1,609
  • Quote
  • Feb 2, 2023 6:41pm Feb 2, 2023 6:41pm
  •  spzd
  • Joined Dec 2010 | Status: Hybrid PA | 3,470 Posts | Online Now
Quoting OAPDave
Disliked
{image}
Ignored
That's mt4? I use mt5. Limits what I can play with ...
Mark ... Either you understand or you don't, and that is that.
 
 
  • Post #1,610
  • Quote
  • Feb 3, 2023 9:53am Feb 3, 2023 9:53am
  •  spzd
  • Joined Dec 2010 | Status: Hybrid PA | 3,470 Posts | Online Now
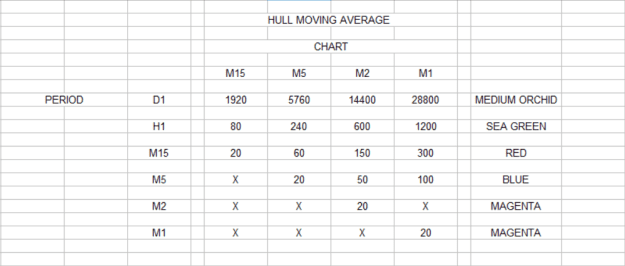
This is it.

Hull parameters.

Attached Image (click to enlarge)
Click to Enlarge

Name: HMA.png
Size: 20 KB


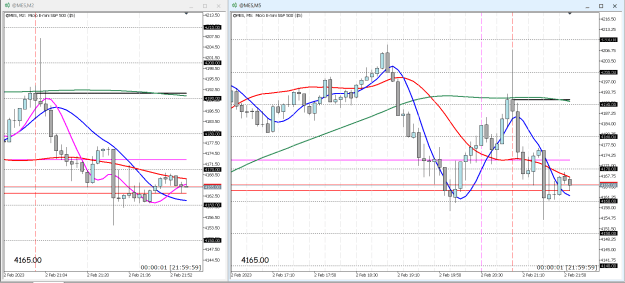
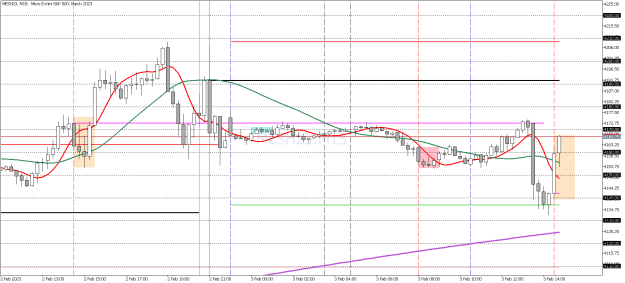
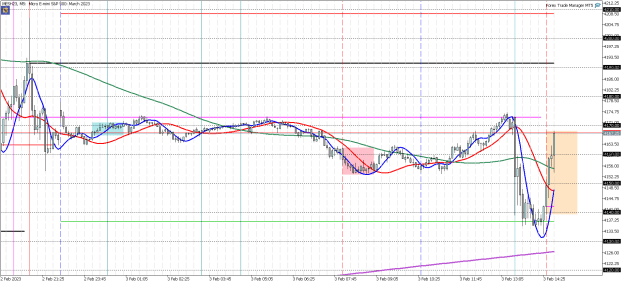
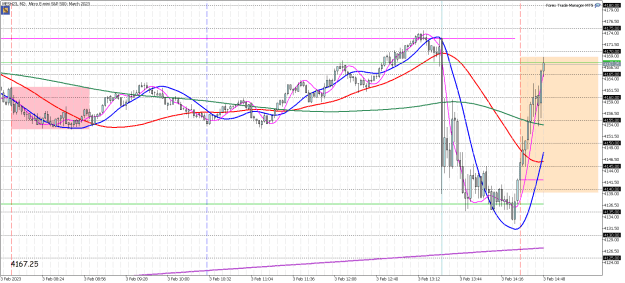
I started using the M2 for entries. To me it is a smoother moving chart vs the M1. I mainly look for where the M5 crosses the M15. It is more than that, but in general that is it.

Attached Image (click to enlarge)
Click to Enlarge

Name: MESH23M15.png
Size: 25 KB


Attached Image (click to enlarge)
Click to Enlarge

Name: MESH23M5.png
Size: 34 KB


Attached Image (click to enlarge)
Click to Enlarge

Name: MESH23M2.png
Size: 34 KB
Mark ... Either you understand or you don't, and that is that.
 
2
  • Post #1,611
  • Quote
  • Feb 3, 2023 9:59am Feb 3, 2023 9:59am
  •  spzd
  • Joined Dec 2010 | Status: Hybrid PA | 3,470 Posts | Online Now
From here forward I am focusing on the MES and MNQ exclusively.

The beauty of trading these is it seems designed for short term trading. I have no real need to consider past market structure as each trading session (day if you only trade the US equities time) is complete within itself.

If you follow this instrument long enough you see that other than the usual levels carried over from the previous day, week (have some impact, not hit too often), and month (seldom hit). Added to this is my Hull suite and it becomes tradable on an as is basis.

The use of MAs drops this from a purer form of PA, but the rules are based around how price reacts to various "environmental" variables both static and dynamic.
Mark ... Either you understand or you don't, and that is that.
 
1
  • Post #1,612
  • Quote
  • Feb 3, 2023 1:51pm Feb 3, 2023 1:51pm
  •  OAPDave
  • Joined Jan 2015 | Status: Member | 3,666 Posts
Quoting spzd
Disliked
From here forward I am focusing on the MES and MNQ exclusively. The beauty of trading these is it seems designed for short term trading. I have no real need to consider past market structure as each trading session (day if you only trade the US equities time) is complete within itself. If you follow this instrument long enough you see that other than the usual levels carried over from the previous day, week (have some impact, not hit too often), and month (seldom hit). Added to this is my Hull suite and it becomes tradable on an as is basis. The...
Ignored
I wish you well my friend
Not sure the wheel needed re inventing
But New tyres could well be needed
You have worked hard and methodically
Good Luck
Dave
 
1
  • Post #1,613
  • Quote
  • Feb 3, 2023 2:14pm Feb 3, 2023 2:14pm
  •  spzd
  • Joined Dec 2010 | Status: Hybrid PA | 3,470 Posts | Online Now
Quoting OAPDave
Disliked
{quote} I wish you well my friend Not sure the wheel needed re inventing But New tyres could well be needed You have worked hard and methodically Good Luck Dave
Ignored
I had to go back and re-study the basics. The final result with the rules is my tweak on the wheel. Ilike to look at as new rims.
Mark ... Either you understand or you don't, and that is that.
 
 
  • Post #1,614
  • Quote
  • Feb 3, 2023 2:56pm Feb 3, 2023 2:56pm
  •  spzd
  • Joined Dec 2010 | Status: Hybrid PA | 3,470 Posts | Online Now
A Very Good Day Pt-1

The closer the Hull is to price (period) the more sensitive it is. That is why you see on the open price sitting on the HMA and the next bar it is inside or outside. This is not repainting. This is the natural change due to the equation and movement of price during that bar. (This goes for any indicator. If the indicator changes after the current bar then it repaints.) For the most part though, there is only minor movement of the HMA.

After watching the video featuring the creator Alan Hull and hearing him describe what it is and how he uses it was a big ego boost as I naturally use the HMA in a similar manner as the originator.

Of course, it took another week to fully assimilate everything.

This brings me to my apex/floor theory. Spot on. The more I observe price the more I see the value of entries near these areas. From this (and this is not where I got it, but it does fit) comes the Buy side/Sell side concept. It all fits so snug.

https://www.forexfactory.com/thread/...4#post14296834

Here is the video:

https://www.forexfactory.com/thread/...8#post14304668
Mark ... Either you understand or you don't, and that is that.
 
1
  • Post #1,615
  • Quote
  • Feb 3, 2023 10:39pm Feb 3, 2023 10:39pm
  •  spzd
  • Joined Dec 2010 | Status: Hybrid PA | 3,470 Posts | Online Now
Quoting spzd
Disliked
A Very Good Day Pt-1 The closer the Hull is to price (period) the more sensitive it is. That is why you see on the open price sitting on the HMA and the next bar it is inside or outside. This is not repainting. This is the natural change due to the equation and movement of price during that bar. (This goes for any indicator. If the indicator changes after the current bar then it repaints.) For the most part though, there is only minor movement of the HMA. After watching the video featuring the creator Alan Hull and hearing him describe what it is...
Ignored
A Very Good Day Pt-2

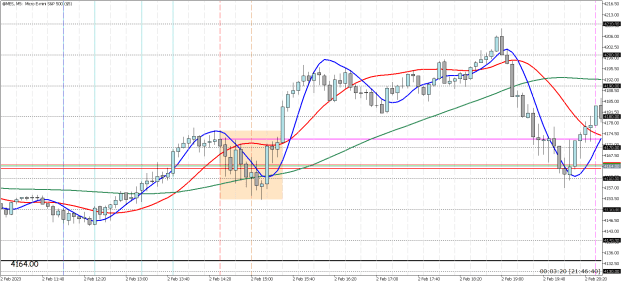
Then there is price itself. Or more specifically, how price reacts within my framework.

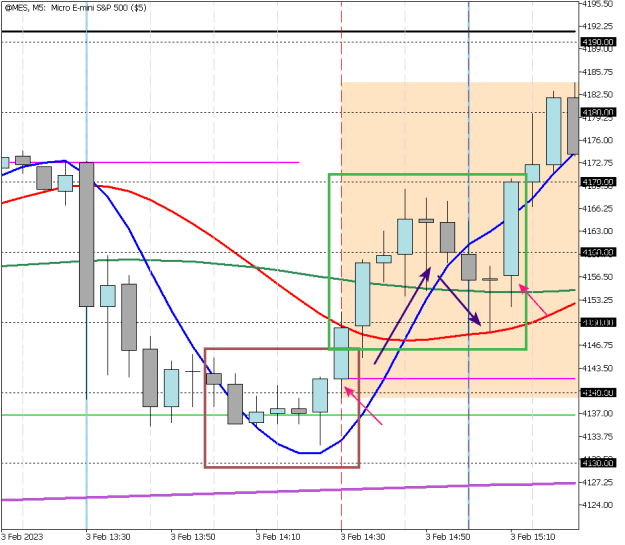
I know when price crosses from one side of a HMA to the other side that price is moving from the Buy side to the Sell side or vice verse from the Sell side to the Buy side. But just that is not sufficient to make an entry as you would end up with a lot of losses with that "strategy" alone. What saves us from the coin flip, the Apex and the Floor. From these entries come the rules for in movement entries. Many possibilities covered.

The major, obvious, reason to enter at one of these points is that they represent turns in the market. Do these turns always equal a good move? NOPE. They do, however, represent the potential for an acceptable move and that is all one needs. This leads to the question, "How does one go about making these entries?".
Price often crosses before the apex/floor. There is also an often within the often of price retracing to or near the apex/floor at or right after the formation of the apex/floor. The next open is the entry as long as it (price) is still on the correct side (buy/sell). The other type of entry at the apex/floor is when price is right there near the HMA and the HMA is showing signs of an apex/floor. Most entries are some form of momentum type where price is showing an inclination to continue in the assumed direction.

The following chart shows two crossing situations. The first, in the brown box, is a sideways crossing of the M5-H. This is a fairly common (I have no data sufficient enough to make any percentile claim. All opinions on this are currently via observation. Besides, I do not have the necessary math skills to do that any justice.) crossing behavior. Here it took 3 bars until the pullback. Entry on the open of the bar with the pink arrow.

The second example followed shortly. It was a crossing of the M15-H. This process is shown in the green box. Here it took some 30 minutes before it came back to the M15-H. From the results, it looks as if the pullback to the M15-H and the close-open above the H1-H had some significance.

Attached Image (click to enlarge)
Click to Enlarge

Name: @MESM5-ex-1.png
Size: 17 KB
Mark ... Either you understand or you don't, and that is that.
 
 
  • Post #1,616
  • Quote
  • Feb 4, 2023 8:31am Feb 4, 2023 8:31am
  •  spzd
  • Joined Dec 2010 | Status: Hybrid PA | 3,470 Posts | Online Now
Quoting FocusWinReal
Disliked
Nice work spzd! A buyside example. HMA 21. AJ after news. 5min. A = after news and before 2nd red news. B after 2nd red news. C target. 13 pips Tp triggered. 15 min gave a better entry earlier before 2nd news as did 30 min and 1 hr but with some drawdown or confusion perhaps when holding. {image}
Ignored
Hull would suggest a band on the HMA that would "aid" in making those entries. That is the general gist.
Mark ... Either you understand or you don't, and that is that.
 
 
  • Post #1,617
  • Quote
  • Feb 4, 2023 11:12am Feb 4, 2023 11:12am
  •  spzd
  • Joined Dec 2010 | Status: Hybrid PA | 3,470 Posts | Online Now
Quoting spzd
Disliked
{quote} A Very Good Day Pt-2 Then there is price itself. Or more specifically, how price reacts within my framework. I know when price crosses from one side of a HMA to the other side that price is moving from the Buy side to the Sell side or vice verse from the Sell side to the Buy side. But just that is not sufficient to make an entry as you would end up with a lot of losses with that "strategy" alone. What saves us from the coin flip, the Apex and the Floor. From these entries come the rules for in movement entries. Many possibilities covered....
Ignored
A Very Good Day Pt-3

Some thoughts on all of this. Very aware that the HMA (or most all indis) are derived from price. And that they lag for the most part. None of that really matters if you can define how price works within your framework (whatever that may be).

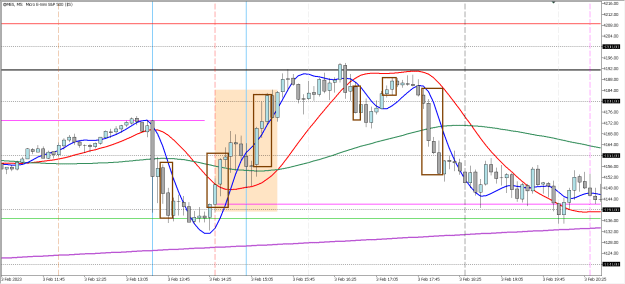
So, I have some smoother squiggly lines and some horizontal lines. Then I watch price in this framework and devise a method to trade it based on the repeatable patterns I observe. I view the HMAs as proxies for price - and price movement - for its "time frame". I have settled on a base of 20 periods. Every chart, no matter the time frame, has a base 20-HMA. The other HMAs are derived from that base. These become my dynamic framework. Dynamic in that they are constantly changing value with price movement.

With the HMAs being proxies for price, I can then discern that price tends to have certain behaviors dependent on the side of the HMA it is currently located (it's all about location, location, location). This results in a Buy side and a Sell side with the HMA being the point of equilibrium between the two.

Now I have a general rule for price movement and through observation I see certain patterns that more often than not result in a profitable trade. The main entry was discussed in the previous Very Good Day post.

This is Friday 3 Feb 2023. Boxes are potential trades. This works.

Attached Image (click to enlarge)
Click to Enlarge

Name: swings.png
Size: 29 KB


One man's noise is another man's $$$
Mark ... Either you understand or you don't, and that is that.
 
1
  • Post #1,618
  • Quote
  • Feb 4, 2023 1:49pm Feb 4, 2023 1:49pm
  •  spzd
  • Joined Dec 2010 | Status: Hybrid PA | 3,470 Posts | Online Now
If you are still arguing over TEs or live calls at this juncture you are likely not much of a trader.
Mark ... Either you understand or you don't, and that is that.
 
 
  • Post #1,619
  • Quote
  • Feb 4, 2023 4:36pm Feb 4, 2023 4:36pm
  •  TimeTells
  • Joined Dec 2018 | Status: Trading, and Music; that'll do lol | 2,926 Posts
Quoting spzd
Disliked
{quote}
A Very Good Day Pt-3 Some thoughts on all of this.
Very aware that the HMA (or most all indis) are derived from price. And that they lag for the most part.
None of that really matters if you can define how price works within your framework (whatever that may be).
So, I have some smoother squiggly lines and some horizontal lines. Then I watch price in this framework and devise a method to trade it based on the repeatable patterns I observe. I view the HMAs as proxies for price - and price movement - for its "time frame". I have...
Ignored

Hi Mark,

Spot on pal and very well done with your template.
I don't follow the indices but it looks like they adhere to Market Mechanics also.
Up, stall, down (back to source)
(The other is up, stall, continue on, and often the same distance as the original up move).
All with the usual shakeout tricks in between.

Your MA's capture it all very well.
 
1
  • Post #1,620
  • Quote
  • Feb 4, 2023 5:04pm Feb 4, 2023 5:04pm
  •  spzd
  • Joined Dec 2010 | Status: Hybrid PA | 3,470 Posts | Online Now
Quoting TimeTells
Disliked
{quote} Hi Mark, Spot on pal and very well done with your template. I don't follow the indices but it looks like they adhere to Market Mechanics also. Up, stall, down (back to source) (The other is up, stall, continue on, and often the same distance as the original up move). All with the usual shakeout tricks in between. Your MA's capture it all very well.
Ignored
The indices, are arguably the epitome of the algo at its fine tuned best. The order is impeccable at times. Other times it can be a challenge. Just like everything. The daily patterns are usually easy to identify. It is geared toward short term trading (in my most knowledgeable yet humble opinion ).

Thanks for the kudos. This template, although seemingly simple, has taken me years to finalize.

Take care
Mark ... Either you understand or you don't, and that is that.
 
1
  • Trading Journals
  • /
  • Volman meets Burke or My journey with PA
  • Reply to Thread
    • 1 7980Page 818283 109
    • 1 Page 81 109
2 traders viewing now, 1 is a member:
fxpider
  • More
Top of Page
  • Facebook
  • Twitter
About FF
  • Mission
  • Products
  • User Guide
  • Media Kit
  • Blog
  • Contact
FF Products
  • Forums
  • Trades
  • Calendar
  • News
  • Market
  • Brokers
  • Trade Explorer
FF Website
  • Homepage
  • Search
  • Members
  • Report a Bug
Follow FF
  • Facebook
  • Twitter

FF Sister Sites:

  • Metals Mine
  • Energy EXCH
  • Crypto Craft

Forex Factory® is a brand of Fair Economy, Inc.

Terms of Service / ©2023