OrderBook is a financial trading indicator that gives a visual representation of different trading activities by retail traders such as pending orders, open trades, and Stop Order. The data collected from the actions of other retail traders are represented in histogram formats on the chart.
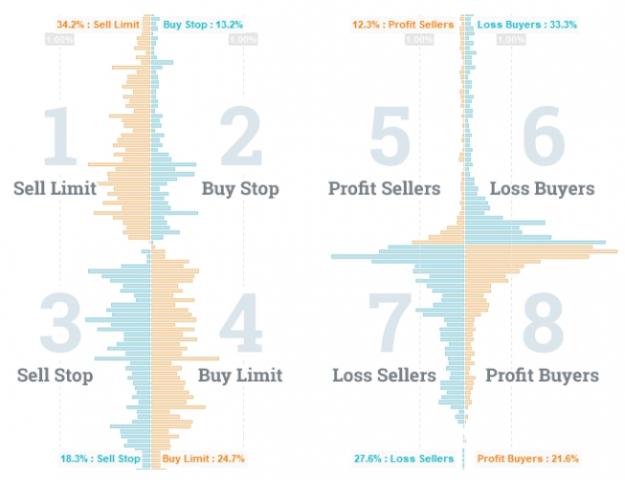
The OrderBook indicator is divided into sections that show the specific trading activities of retail traders. This includes the Sell Limit, Buy Stop, Profit Sellers, Loss Buyers, Sell Stop, etc. This in turn gives you a clear-cut edge when analyzing each market situation for trading opportunities.
Features of The OrderBook Indicator
The indicator is integrated with several intuitive features to give traders the best experience for more productive analysis. Let's take a look at some of the salient features of the OrderBook indicator.
● Cast time: This feature shows the time that the cast was last updated.
● History navigation: This is a feature that shows the time history of all the casts.
● Red cross mark: This tool comes in handy to view the price and time of a particular cast.
● Fast access to data: This feature enables users to easily navigate through the indicator's panel with just a button push.
● Four layouts: The indicator displays the collected data in four-layout patterns like the simplified/classic and the one-sided/two-sided pattern.
● Auto settings: This feature enables the indicator to automatically detect color schemes and time zones.
Finally, the OrderBook indicator is also incorporated with an automatic update system that automatically downloads and installs the latest version.
How to Trade With The OrderBook Indicator
At this point, it is important to state that the OrderBook indicator is not a signal-generating indicator per se. The indicator is not meant to generate a direct BUY or SELL signal, but rather helps you to spot a potential BUY/SELL opportunity from the abnormal clusters among buyers and sellers.
So in essence, the indicator is a good handy tool for making in-depth technical analysis for both entries and exits. This is because it helps you to see several activities of other retail traders which are not visible in typical MT4 platforms.
BUY Trade Opportunity
The above annotations of the screenshot shows potential BUY/LONG opportunities due to the following reasons:
1. It shows the clusters of sellers' Stop Losses which tend to attract the price.
2. The price is being pushed up by the dominant winning sellers.
3. It also shows the clusters of BUY limit orders that act as potential support.
4. Finally, the price is being pushed up by the dominant losing sellers.
SELL Trade Opportunity

The above annotations of the screenshot shows potential SELL/SHORT opportunities due to the following reasons:
1. The clusters of buyers' stop losses tend to attract the price.
2. The price is being pulled down by dominant winning buyers.
3. It also shows the clusters of SELL limit orders that act as potential resistance.
4. The price is being pushed down by dominant losing buyers.
OrderBook Indicator Settings

OrderBook Depth - This parameter is used to determine the number of histogram bars for the horizontal column of the indicator.
Layout - This is used to determine the layout view of the indicator.
Offset from the Right Side, Dist. - These parameters are used to determine where the histograms are positioned on your chart.
History Navigation - This is a parameter to enable/disable the navigation of cast history.
Show Navigation Buttons when Minimized - This keeps the rewinding panel active for easy access.
Fast Rewind Speed - A parameter used to set the rewinding speed.
Show Scale on Chart - A parameter to enable/disable the vertical scale bars of the histogram.
Orders/Positions - This is used to define how far the vertical scale lines are drawn on the chart.
Indicator Panel Position - This is used to determine the position of the indicator's panel.
Vertical, Horizontal Offset - This option is used to set the offset of the indicator's position.
Panel Initial Size - This parameter is used to keep the panel minimized/maximized.
Left Side/Right Side-Default Data - This shows parameters for the default data type.
Left Side/Right Side-Default Filter - This shows the default net value.
Add All/Net Filters - A parameter to enable/disable the indicator from net value mode.
Color Scheme - This is used to assign a color to the indicator. The indicator is however designed to automatically select a befitting color that syncs with your chart background.
Indicator installation
Download Link
1. Download and unzip the archive to the MQL4 folder of the terminal;
2. Restart the terminal and run the indicator;
3. Allow import of DLLs.
The OrderBook indicator is divided into sections that show the specific trading activities of retail traders. This includes the Sell Limit, Buy Stop, Profit Sellers, Loss Buyers, Sell Stop, etc. This in turn gives you a clear-cut edge when analyzing each market situation for trading opportunities.
Attached Image (click to enlarge)
Features of The OrderBook Indicator
The indicator is integrated with several intuitive features to give traders the best experience for more productive analysis. Let's take a look at some of the salient features of the OrderBook indicator.
● Cast time: This feature shows the time that the cast was last updated.
● History navigation: This is a feature that shows the time history of all the casts.
● Red cross mark: This tool comes in handy to view the price and time of a particular cast.
● Fast access to data: This feature enables users to easily navigate through the indicator's panel with just a button push.
● Four layouts: The indicator displays the collected data in four-layout patterns like the simplified/classic and the one-sided/two-sided pattern.
● Auto settings: This feature enables the indicator to automatically detect color schemes and time zones.
Finally, the OrderBook indicator is also incorporated with an automatic update system that automatically downloads and installs the latest version.
How to Trade With The OrderBook Indicator
At this point, it is important to state that the OrderBook indicator is not a signal-generating indicator per se. The indicator is not meant to generate a direct BUY or SELL signal, but rather helps you to spot a potential BUY/SELL opportunity from the abnormal clusters among buyers and sellers.
So in essence, the indicator is a good handy tool for making in-depth technical analysis for both entries and exits. This is because it helps you to see several activities of other retail traders which are not visible in typical MT4 platforms.
BUY Trade Opportunity
Attached Image (click to enlarge)
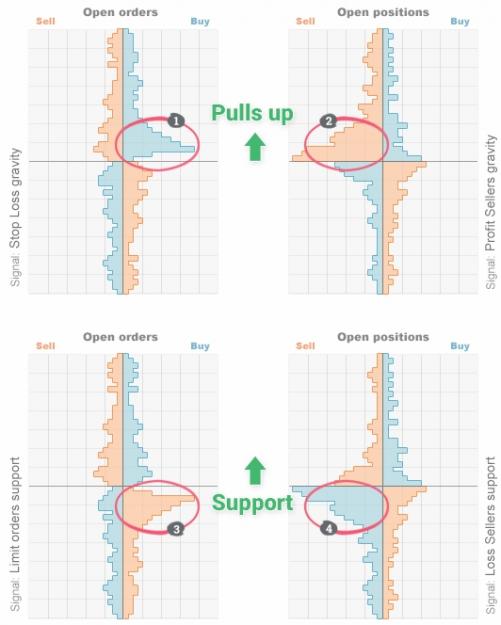
The above annotations of the screenshot shows potential BUY/LONG opportunities due to the following reasons:
1. It shows the clusters of sellers' Stop Losses which tend to attract the price.
2. The price is being pushed up by the dominant winning sellers.
3. It also shows the clusters of BUY limit orders that act as potential support.
4. Finally, the price is being pushed up by the dominant losing sellers.
SELL Trade Opportunity
Attached Image (click to enlarge)
The above annotations of the screenshot shows potential SELL/SHORT opportunities due to the following reasons:
1. The clusters of buyers' stop losses tend to attract the price.
2. The price is being pulled down by dominant winning buyers.
3. It also shows the clusters of SELL limit orders that act as potential resistance.
4. The price is being pushed down by dominant losing buyers.
OrderBook Indicator Settings
Attached Image (click to enlarge)
OrderBook Depth - This parameter is used to determine the number of histogram bars for the horizontal column of the indicator.
Layout - This is used to determine the layout view of the indicator.
Offset from the Right Side, Dist. - These parameters are used to determine where the histograms are positioned on your chart.
History Navigation - This is a parameter to enable/disable the navigation of cast history.
Show Navigation Buttons when Minimized - This keeps the rewinding panel active for easy access.
Fast Rewind Speed - A parameter used to set the rewinding speed.
Show Scale on Chart - A parameter to enable/disable the vertical scale bars of the histogram.
Orders/Positions - This is used to define how far the vertical scale lines are drawn on the chart.
Indicator Panel Position - This is used to determine the position of the indicator's panel.
Vertical, Horizontal Offset - This option is used to set the offset of the indicator's position.
Panel Initial Size - This parameter is used to keep the panel minimized/maximized.
Left Side/Right Side-Default Data - This shows parameters for the default data type.
Left Side/Right Side-Default Filter - This shows the default net value.
Add All/Net Filters - A parameter to enable/disable the indicator from net value mode.
Color Scheme - This is used to assign a color to the indicator. The indicator is however designed to automatically select a befitting color that syncs with your chart background.
Indicator installation
Download Link
1. Download and unzip the archive to the MQL4 folder of the terminal;
2. Restart the terminal and run the indicator;
3. Allow import of DLLs.