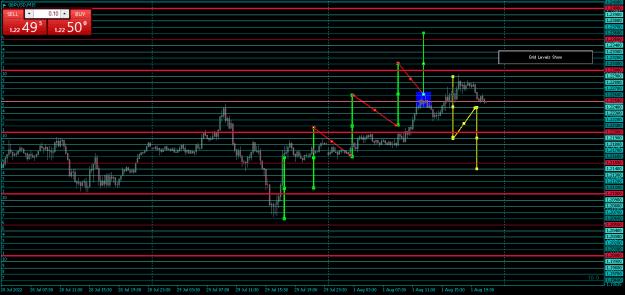
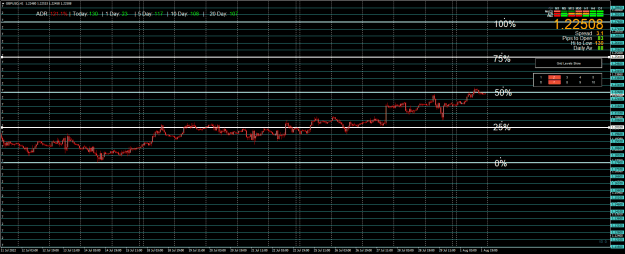
Question Tony....now that cable seems to have peaked and has pulled back, would you then draw a potential short scenario (yellow) from the high {image}
Ignored
Yes, every D is an A in the opposite direction and can supply a potential 40 - 50 pips on the leg.
july low (7) was 1.17600. Using the price breakdown shown in previous postings: Ab 50% 1.17600 - 5000 = 1.12600 ab 50% 1.17600 + 5000 = 1.22600 ____________________________ ab 100% 1.17600 - 10000 = 1.07600 ab 100% 1.17600 + 10000 = 1.27600 someone provide the calculation for 25% and 75%
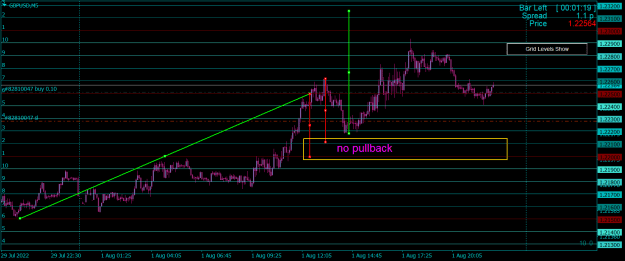
For SWEDE, no pullback to C after hitting a D is a sign of temporary strength in that trend direction, which could lead to further strength and a continuation of the move. However, my buy trade here is risky because 1.22600 is the TP for the July 7 low of 1.17600.
{quote} I just did it in my head... 1f 100% equals 1000 then 75% equals 7500, and 50% equals 5000, then 25% equals 2500 Then its plus/minus from the starting point of 1.17600
Ignored
Yes that is correct but what prices do you get from those points, like I showed, SPEEDY.
For SWEDE, no pullback to C after hitting a D is a sign of temporary strength in that trend direction, which could lead to further strength and a continuation of the move. However, my buy trade here is risky because 1.22600 is the TP for the July 7 low of 1.17600.{image}
Ignored
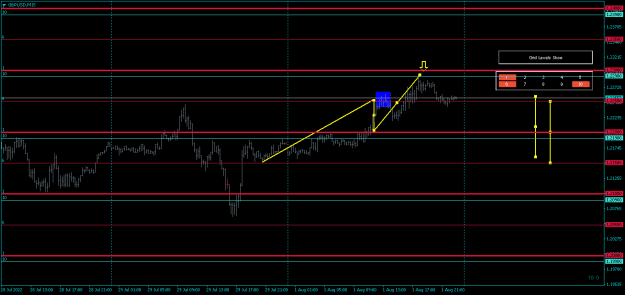
So then, had price actually reached C to validate C, then on to D.....this would have been a valid SHORT....correct? Chart below
{quote} Yes that is correct but what prices do you get from those points, like I showed, SPEEDY.
Ignored
ok....not following at this point can you direct me ....thanks......and thanks for all the replies and the work involved...I have always tried to give good content when posting, but this is kind of new...
{quote} ok....not following at this point can you direct me ....thanks......and thanks for all the replies and the work involved...I have always tried to give good content when posting, but this is kind of new...
Ignored
Like this, showing the prices you get:
AB 50% 1.17600 - 5000 = 1.12600
AB 50% 1.17600 + 5000 = 1.22600
____________________________
AB 100% 1.17600 - 10000 = 1.07600
AB 100% 1.17600 + 10000 = 1.27600
You are a fast thinker and learner and that can be frustrating when waiting on someone else to show something further, but I am presenting it this way so I don't have to repeat info and I can limit my responses to nuances after there is a reference to look at. Also it will actually be a faster learning process in the long run.
BTW I did not level this task to just you, anyone can answer it.
{quote} So then, had price actually reached C to validate C, then on to D.....this would have been a valid SHORT....correct? Chart below {image}
Ignored
No, that is not the only qualifier. Everything I do and use has its own part in determining strength and weakness in the market, but just like MTF methodology, the larger ABCD's take precedent. There is a probability meter that is built in the ABCD's with a risk associated at every level for success. I will have to show that before you understand completely.
{quote} Like this, showing the prices you get: AB 50% 1.17600 - 5000 = 1.12600 AB 50% 1.17600 + 5000 = 1.22600 ____________________________ AB 100% 1.17600 - 10000 = 1.07600 AB 100% 1.17600 + 10000 = 1.27600 You are a fast thinker and learner and that can be frustrating when waiting on someone else to show something further, but I am presenting it this way so I don't have to repeat info and I can limit my responses to nuances after there is a reference to look at. Also it will actually be a faster learning process in the long run. BTW I did not...
Ignored
ok, getting this now, so we are at the 1.22600 50%, either a good place to short, or if a clean break north could head to 1.25100 with a few stops along the way..lol
{quote} ok, getting this now, so we are at the 1.22600 50%, either a good place to short, or if a clean break north could head to 1.25100 with a few stops along the way..lol
All very interesting... I wish I had studied my maths when in school!!! I have been reading Diamond threads as well with Parisboy, Swede and others. It goes over my head quite regularly
However, I don't give up that easily, keep up the good work Fellas.
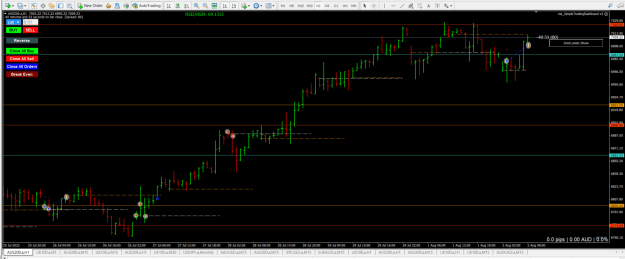
Now on a thin day like today (with many bank holidays in the world) I watched price try to head north only to stall at what I normally would have taken short, but hesitated wondering if the thin market would keep heading north. Anyway, cutting the setting in half (5) instead of (10) to allow for the smaller range, there was a very clear abcd.....should have taken it...would have banked 55 pips so far....what are your thoughts on reducing the settings to allow for smaller range? {image}
Ignored
RBA decision this afternoon helped to move anything to do with the AUD...
{quote} Swede In hindsight I think it's better to keep to a stable pattern For this month it's 7 2 7 ps Any thread that interest me, some how I mange to kill dead !!!! {image} {image}
Tony I guess this is Top Secret How do you determine the Monthly Pattern Yes I know you use the previous months low but what next ? ps What Pattern is the DAX in ? Thanks PPs You said USED TO ?
Ignored
Hi Dave,
Determine the monthly pattern? I don't understand, I only use grid patterns. Time frames are only to show the amount of candles needed.
My broker no longer provides it for some reason, Why don't you attempt to label you chart and post it and I will give you the adjustments and corrections?