Disliked{quote} Hi gepards Its best to pick it up on the footprint chart, the DOM can also help for order balance.
Here is what stop loss clusters look like via data.
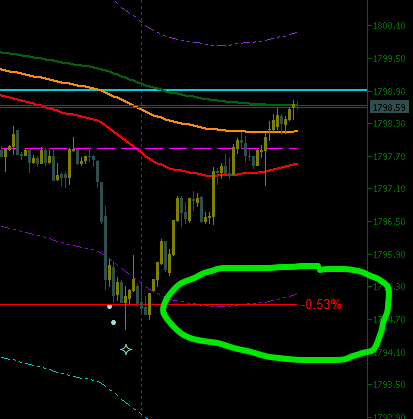
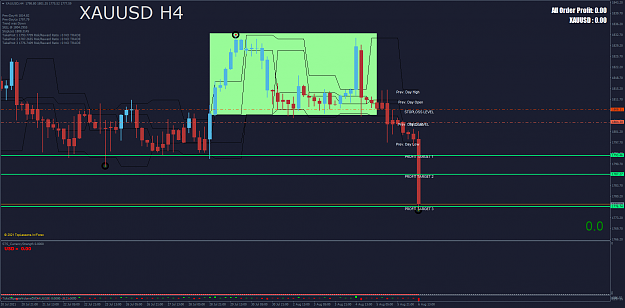
This was a Gold day low that ryuryu and myself traded 10 minutes ago.
Notice the numbers in the box show us exhaustion occurring in the Bids & Asks as the market just ran the Stop Loss clusters.
Imbalance is the Yellow or white numbers.
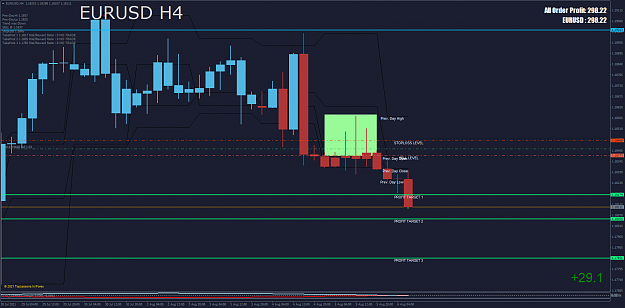
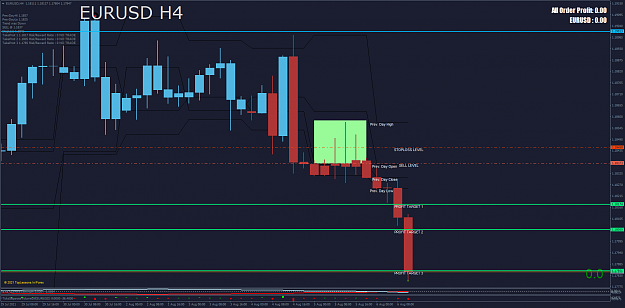
Yes - BUY {image}Ignored
Hi RickM,
As always your charts are intriguing
I have read your notes a while back about the PVSRA vol indi (from another thread), and concur with your findings.
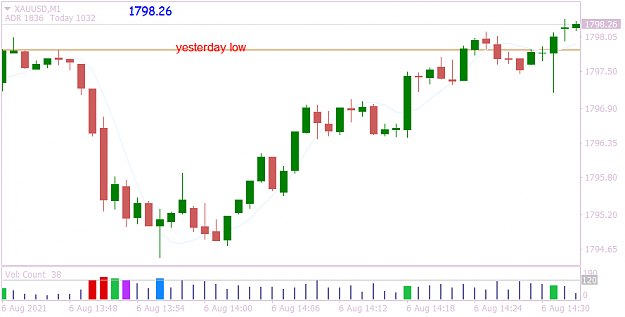
I cannot use them confidently, but print them on my charts for the 1min TF only.
And I try to always find some "crossover info" compared to your own.
(I keep studying and looking for some value correlation, but not for me yet
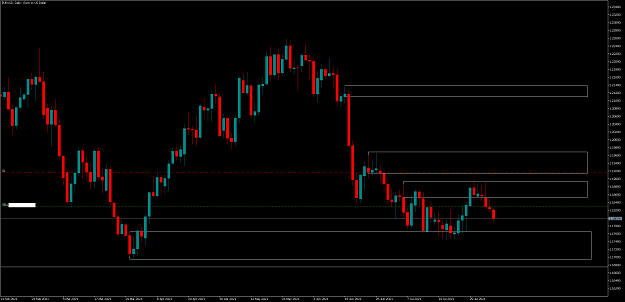
I do NOT trade Gold, but printed out my chart just for an interest. Thank you for posting yours.
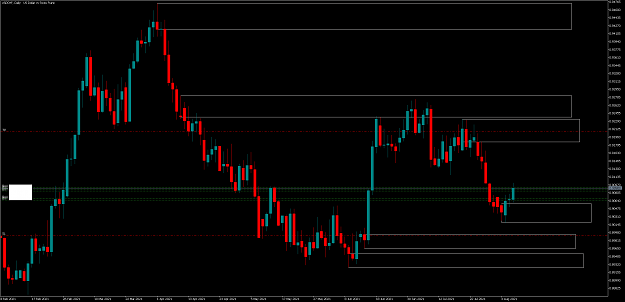
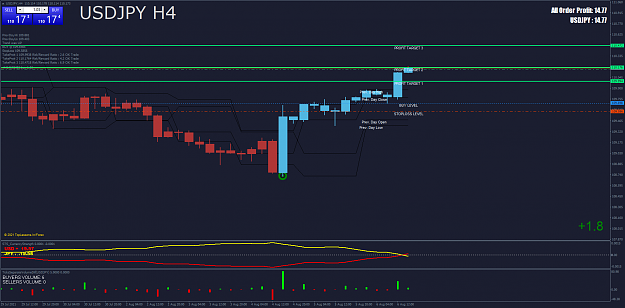
My day is done with just 8 pips in total on the up & down on USDJPY only.
It is NFP night and I'm bailing out now beforehand, as usual.
All the best to all venturing on. Good pips to you.
.
Attached Image (click to enlarge)
1