This is a Multi pair and Multi time frame Scanner. it is looking for Divergence on MACD and can inform you visually on Dashboard or by alert.
you can choose to scan Regular Divergence or Hidden Divergence
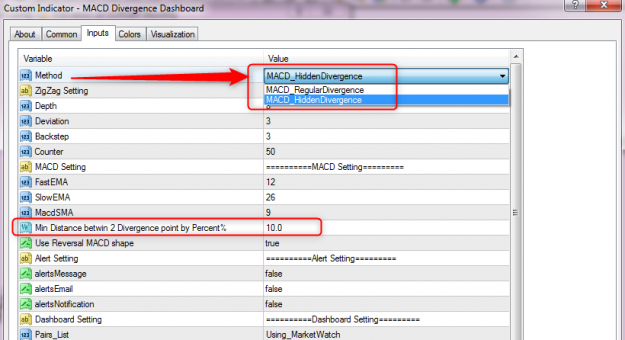
in setting you can also choose how much be the distance between two divergent points by percent. this simple technic can increase the accuracy of a RD, specially if you set it upper than 90%, and also if you have a look on your higher timeframe to make sure there is a good S & R area in direction with trend.
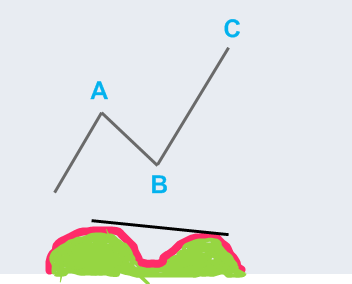
how this filter work? for example in this pic we have a sell divergence between point A and C, if you set the distance filter to 100%, dashboard measure the size of AB wave, and will trigger this sell divergence if the BC length be equal to 100% of AB length.
Features:
*All the boxes are clickable so you can simply go to your intended pair or time frame with only one click
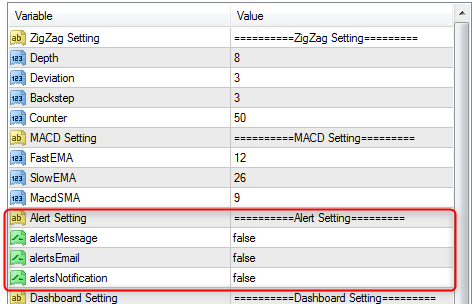
*All possible types of alerts (popup-push notifications-email)
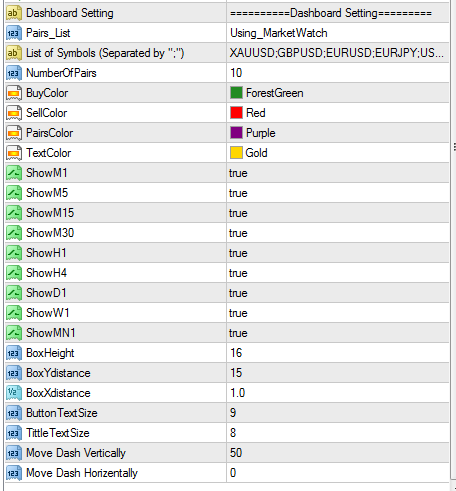
*You can choose your pairs list to automatically use Market Watch or from manual created list
*All dashboard features are adjustable. (such as: the Y distance of the entire dashboard, text font size, the height of boxes and the Y distance between boxes, box colors)
*You can show or hide the time frames that you want.
*you can limit the number of pairs in dashboard (suitable for slow PCs)
*Never miss a Divergence again - "MultiPair and MultiTimeFrame Alert Scanner"
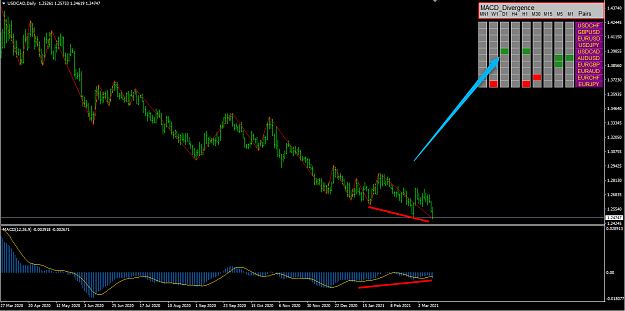
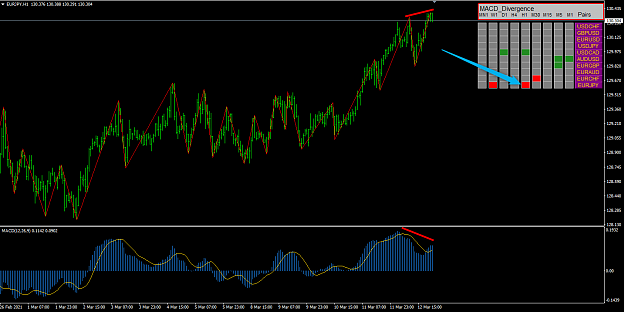
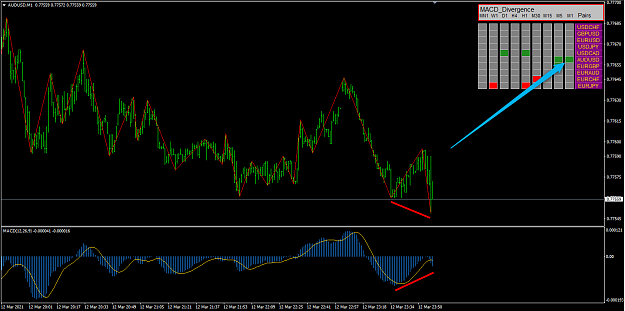
as you see in the pics, this scanner is using a zigzag, so we ensure it is choosing correct high/lows to recognize a divergence. just make sure to set your zigzag input based on your desired MACD to get reliable signals, or simply use the default settings in dashboard.
examples of RD recognized by dashboard:
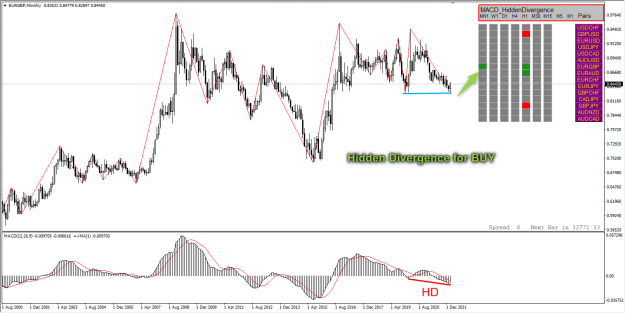
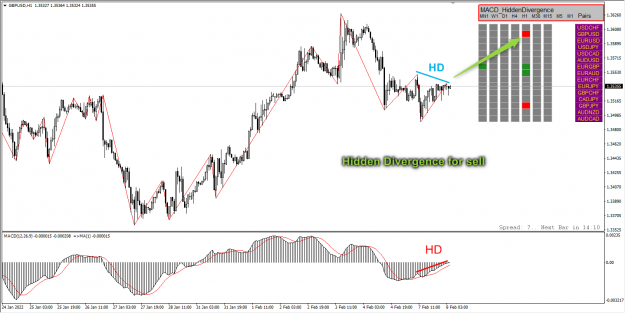
examples of HD recognized by dashboard:
for purchasing contact on telegram @amirtrader
you can choose to scan Regular Divergence or Hidden Divergence
Attached Image (click to enlarge)
in setting you can also choose how much be the distance between two divergent points by percent. this simple technic can increase the accuracy of a RD, specially if you set it upper than 90%, and also if you have a look on your higher timeframe to make sure there is a good S & R area in direction with trend.
how this filter work? for example in this pic we have a sell divergence between point A and C, if you set the distance filter to 100%, dashboard measure the size of AB wave, and will trigger this sell divergence if the BC length be equal to 100% of AB length.
Attached Image (click to enlarge)
Features:
*All the boxes are clickable so you can simply go to your intended pair or time frame with only one click
*All possible types of alerts (popup-push notifications-email)
*You can choose your pairs list to automatically use Market Watch or from manual created list
*All dashboard features are adjustable. (such as: the Y distance of the entire dashboard, text font size, the height of boxes and the Y distance between boxes, box colors)
*You can show or hide the time frames that you want.
*you can limit the number of pairs in dashboard (suitable for slow PCs)
*Never miss a Divergence again - "MultiPair and MultiTimeFrame Alert Scanner"
as you see in the pics, this scanner is using a zigzag, so we ensure it is choosing correct high/lows to recognize a divergence. just make sure to set your zigzag input based on your desired MACD to get reliable signals, or simply use the default settings in dashboard.
Attached Image
Attached Image
examples of RD recognized by dashboard:
Attached Image (click to enlarge)
Attached Image (click to enlarge)
Attached Image (click to enlarge)
examples of HD recognized by dashboard:
Attached Image (click to enlarge)
Attached Image (click to enlarge)
for purchasing contact on telegram @amirtrader
Attached File(s)
join BBMA Dashboard channel @amirbbma on Telegram for latest version