• Home
  • Forums
  • Trades
  • News
  • Calendar
  • Market
  • Brokers
  • Login
  • Join
  • User/Email: Password:
  • 1:03pm
Menu
  • Forums
  • Trades
  • News
  • Calendar
  • Market
  • Brokers
  • Login
  • Join
  • 1:03pm
Sister Sites
  • Metals Mine
  • Energy EXCH
  • Crypto Craft

Options

Bookmark Thread

First Page First Unread Last Page Last Post

Print Thread

Similar Threads

Bollinger bands 100 period entry+exit system 14 replies

Non's Bollinger Bands EA trading system 2 replies

Bollinger Bands Range And Trend Trading 21 replies

Please help with MT4 , Bollinger Bands , Starc Bands generating bad signals 1 reply

Bollinger Bands Trading and Indicators 0 replies

  • Trading Systems
  • /
  • Reply to Thread
  • Subscribe
  • 5
Attachments: Revised Bollinger Bands Trading System
Exit Attachments
Tags: Revised Bollinger Bands Trading System
Cancel

Revised Bollinger Bands Trading System

  • Post #1
  • Quote
  • First Post: Dec 20, 2020 5:42am Dec 20, 2020 5:42am
  •  zoheb01
  • Joined Aug 2016 | Status: Member | 461 Posts
Hey Traders,

Today I wanted to share my revised Bollinger Bands Trading Strategy with you.

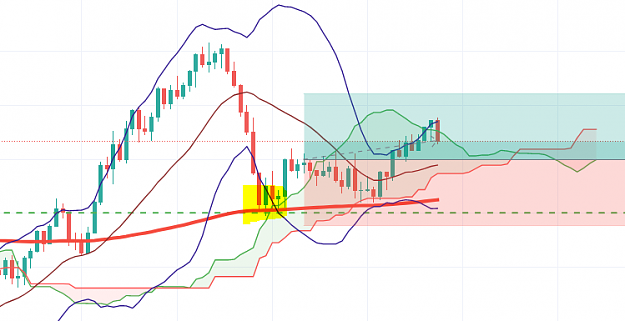
I love using the Bollinger Bands as a mean reversion trading system (when price touches or closes outside of the upper/lower bands). However, we know during volatile trending markets you can get caught out.

This is why I've created a system that uses Bollinger Bands to IDENTIFY A PULLBACK in the trend. Using this reduces the signals of the Bollinger Band and the signals it does make more reliable.

That is still not enough...

I also use the below technical tools below to determine the probability of a successful trade which helps determine my risk.

1) Divergence
2) Round Numbers
3) Ichimoku Kumo Cloud
4) MACD / Stochastics

The full outline of the strategy with examples is below. Let me know if you have any questions:

Inserted Video


Thanks,
Zoheb.
Never stop investing. Never stop improving. Never stop doing something new
  • Post #2
  • Quote
  • Dec 20, 2020 2:35pm Dec 20, 2020 2:35pm
  •  drsa1970
  • | Joined Feb 2018 | Status: Member | 247 Posts
Many tnx Zoheb,
Perfect ....
If you don't build your DREAM, Someone will hire to help build theirs ...
 
 
  • Post #3
  • Quote
  • Dec 21, 2020 9:28am Dec 21, 2020 9:28am
  •  zoheb01
  • Joined Aug 2016 | Status: Member | 461 Posts
I'm long the EURCAD M1 Chart

Attached Image (click to enlarge)
Click to Enlarge

Name: 1009e8b2ff0749064f899e1b2c837fdb.png
Size: 53 KB


Price above EMA and Cloud and entered on big bullish engulfing bar for a 1-1.

When price hit the lower BB - it was close to round number level and 200 EMA.
Never stop investing. Never stop improving. Never stop doing something new
 
1
  • Post #4
  • Quote
  • Dec 21, 2020 12:31pm Dec 21, 2020 12:31pm
  •  PixelSniper
  • Joined Dec 2020 | Status: Member | 551 Posts
BB is simply the best indicator to show you what's happening at the moment, especially on the 1m TF.
It adapts quickly to the price and helps to identify breakouts, continuations, determine low & highs.
Itself alone maybe not be enough to trade, but combined with a good traders skill, it's a real killer imo.

It is beautiful, especially in ranging markets to scalp.
And the trending ones, that rushes downward or upside, you can get an idea that the trend will end and a reversal might occur when price retraces back to mid BB etc.
Attached Image (click to enlarge)
Click to Enlarge

Name: asd123.png
Size: 86 KB
Tribute To My Chinese Buddy All Time Return: 19.0%
 
 
  • Post #5
  • Quote
  • Dec 21, 2020 2:29pm Dec 21, 2020 2:29pm
  •  Drewm
  • | Joined Dec 2020 | Status: Junior Member | 5 Posts
My understanding of bullish divergence is where price is exhibiting lower highs but momentum is showing higher highs. The video example is actually demonstrating bearish divergence but the trend continues anyway. That is, the price exhibits higher highs but the momentum showed lower lows. Anyway divergence works more reliably when considered on a higher time frame to the trading time frame.
 
 
  • Post #6
  • Quote
  • Dec 23, 2020 5:49am Dec 23, 2020 5:49am
  •  zoheb01
  • Joined Aug 2016 | Status: Member | 461 Posts
Quoting PixelSniper
Disliked
BB is simply the best indicator to show you what's happening at the moment, especially on the 1m TF. It adapts quickly to the price and helps to identify breakouts, continuations, determine low & highs. Itself alone maybe not be enough to trade, but combined with a good traders skill, it's a real killer imo. It is beautiful, especially in ranging markets to scalp. And the trending ones, that rushes downward or upside, you can get an idea that the trend will end and a reversal might occur when price retraces back to mid BB etc. {image}
Ignored
Yes the BB is a great tool. I'm looking at a lower timeframe trend strategy which uses BB retrace as the foundation to the strategy
Never stop investing. Never stop improving. Never stop doing something new
 
 
  • Post #7
  • Quote
  • Edited 11:15pm Mar 21, 2021 5:13pm | Edited 11:15pm
  •  ateam1964
  • | Joined Mar 2021 | Status: Junior Member | 2 Posts
Attached File(s)
File Type: mq4 ogt.mq4   5 KB | 309 downloads

Hey Gang,

In trying to minimize how much one has to evaluate on each candle, the attached indicator was created. It basically does the first 3 criteria (above/below 200EMA, above/below Ish cloud, upper/lower BB touch) and puts a blue arrow for long and red arrow for shorts on the next candle. By adding this to the chart, one can focus on the subjective decisions ('near' a 00 or 50, candle patterns like engulfing, stochastic values) for confirmation of trade entry.

The source is provided so it can be modified to fit your style. Please let me know what you think.

Cheers
 
3
  • Post #8
  • Quote
  • Edited 8:34am Mar 22, 2021 6:18am | Edited 8:34am
  •  drsa1970
  • | Joined Feb 2018 | Status: Member | 247 Posts
Dear Ateam1964
Great Job ...
Many thanks for sharing your indicator. Please look at below image
Attached Image (click to enlarge)
Click to Enlarge

Name: BB.jpg
Size: 365 KB
If you don't build your DREAM, Someone will hire to help build theirs ...
 
 
  • Post #9
  • Quote
  • Mar 22, 2021 8:33am Mar 22, 2021 8:33am
  •  drsa1970
  • | Joined Feb 2018 | Status: Member | 247 Posts
And below signals should be valid as well ...
Attached Image (click to enlarge)
Click to Enlarge

Name: BB2.jpg
Size: 421 KB
If you don't build your DREAM, Someone will hire to help build theirs ...
 
 
  • Post #10
  • Quote
  • Last Post: Mar 22, 2021 11:32pm Mar 22, 2021 11:32pm
  •  ateam1964
  • | Joined Mar 2021 | Status: Junior Member | 2 Posts
It looks like i have set to signal on close not on touch, so i need to fix that but it explains why wicks that break are not getting signaleed vs ones that close on the expected side of the appropriate band. Good catch and thanks for the info...i will effort a correction and repost when it is completed.
 
1
  • Trading Systems
  • /
  • Revised Bollinger Bands Trading System
  • Reply to Thread
0 traders viewing now
Top of Page
  • Facebook
  • Twitter
About FF
  • Mission
  • Products
  • User Guide
  • Media Kit
  • Blog
  • Contact
FF Products
  • Forums
  • Trades
  • Calendar
  • News
  • Market
  • Brokers
  • Trade Explorer
FF Website
  • Homepage
  • Search
  • Members
  • Report a Bug
Follow FF
  • Facebook
  • Twitter

FF Sister Sites:

  • Metals Mine
  • Energy EXCH
  • Crypto Craft

Forex Factory® is a brand of Fair Economy, Inc.

Terms of Service / ©2023