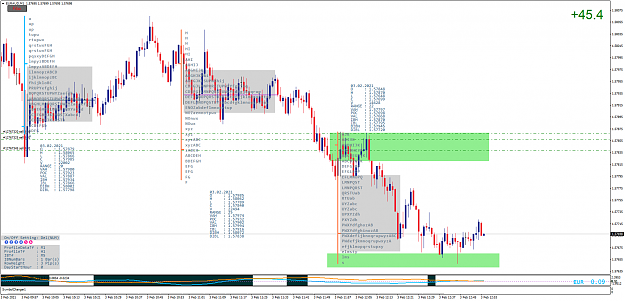
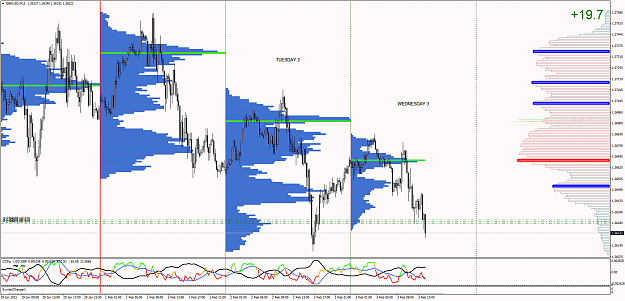
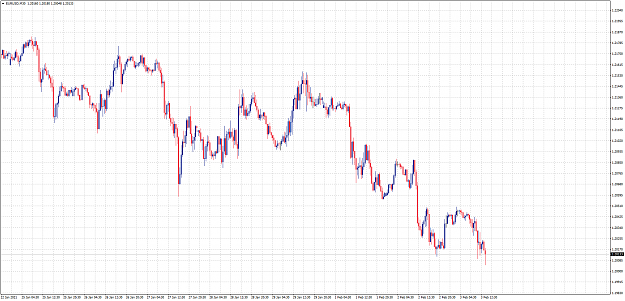
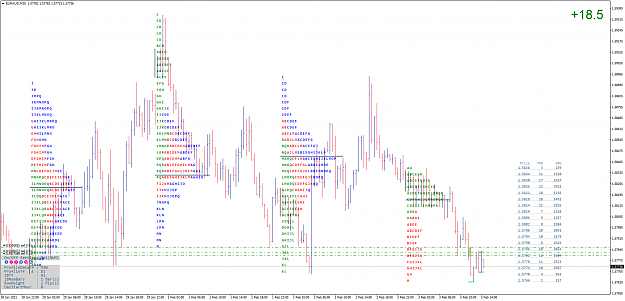
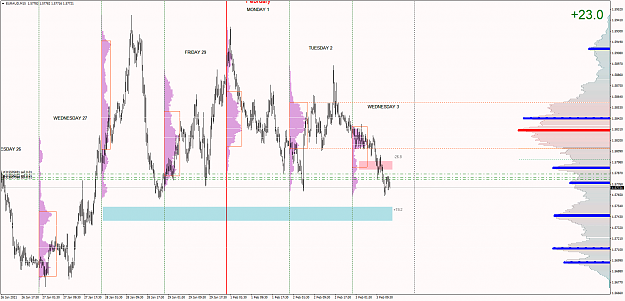
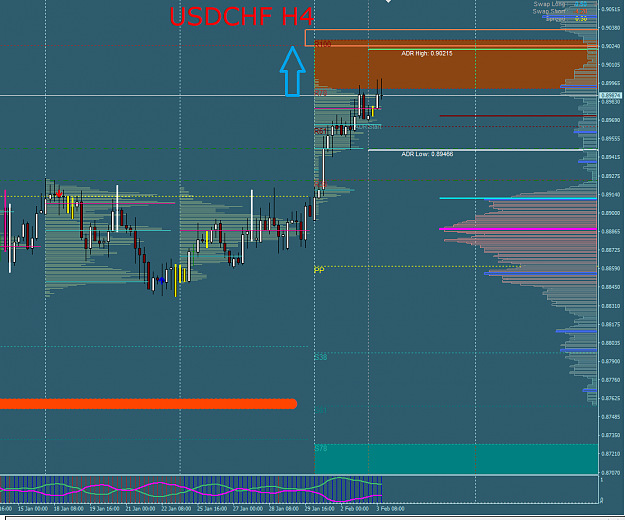
as long as we write am i short m1 we see the volume getting bigger and bigger towards the south I don't know why that's the case, I'm more a seller {image} {image}
Hello, Kette,
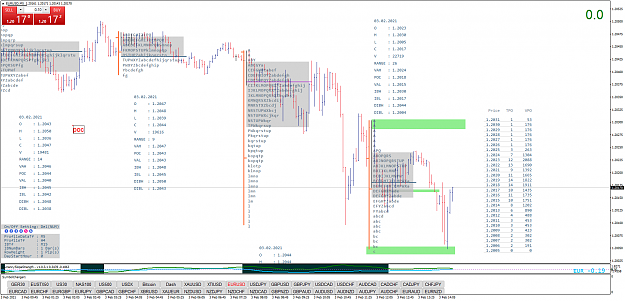
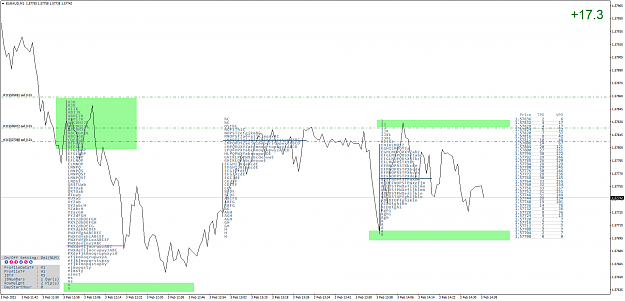
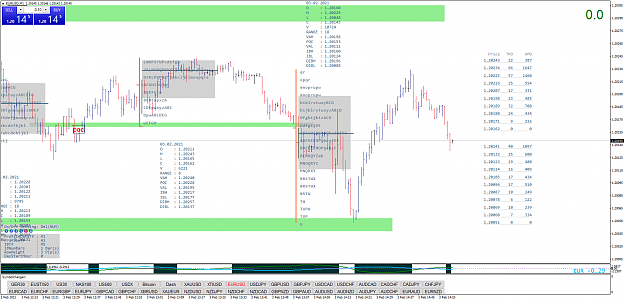
When the price reaches buy area, the VPO value on the right side increases. In this area, you often enter sell, but our understanding is to enter buy. Is our understanding wrong? Can you explain it?
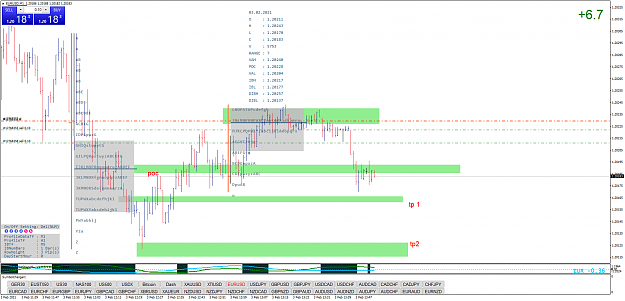
Hello, Kette, When the price reaches buy area, the VPO value on the right side increases. In this area, you often enter sell, but our understanding is to enter buy. Is our understanding wrong? Can you explain it? {image}
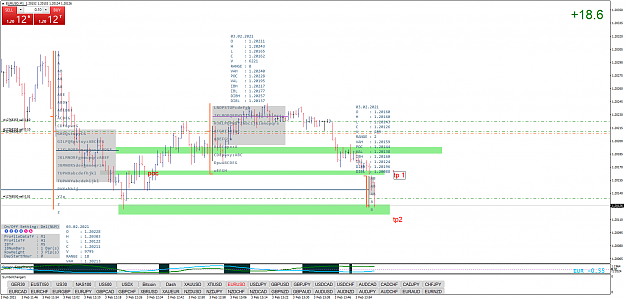
Hello, Kette, When the price reaches buy area, the VPO value on the right side increases. In this area, you often enter sell, but our understanding is to enter buy. Is our understanding wrong? Can you explain it? {image}
Ignored
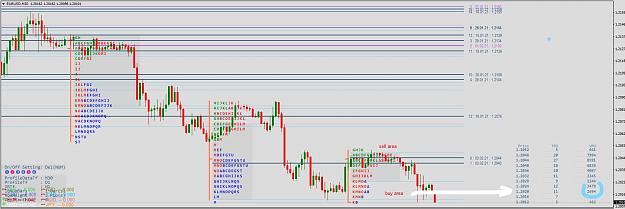
your question is good, today selling is hot
we have a trend
if buy then at 0 demand
{quote} if buy then at 0 demand But if the price continues to fall, 0 will become 1. We need to refer to what trend will reverse, or at what appropriate price level to enter buy.
Ignored
from experience m1 or m5 I would buy at 0 or 1
eu has a downward trend
that's why I had sold as you could see
that is the end of it for me