RBA Strategy
The name of the strategy evolved over time. I shortened it to a more conventional name for easy reference.
August 19 Update
The strategy has been modified slightly. The underlying principle of ADR bands remain the same. For full details about the new updates, read here, here and here.
Do not post until you have digested the threads connected. We now focus on H1 and H4.
Introduction
To all traders, this thread is dedicated to a developing project the community (Robots4Me et al) have been working on. This thread is not for newbies. We will not entertain newbie questions. Make sure you have strong money management skills before you try this out. The market is unpredictable and it can swing against you by a thousand pips. This thread will only help you to identify buy and sell zones. It is not a magic method to become wealthy.
Robots4Me has been generous. He worked tirelessly to develop the indicators and EA. The rest of the community have been testing and giving quality feedbacks.
Purpose of thread
The purpose of this thread is to use the tools, and provide inputs for developing the tools to finished product. Market situations may change and the method may fail. So be careful. I am not here claiming to know everything or to have spent 1 million hours of screen time. Share your inputs and let's grow together in knowledge. All ideas are welcome.
When posting your screenshots, please remove all other indicators. We want clean charts. Only the indicator designed specifically for this thread is allowed.
How it started
The project started here.
The 2 main threads linked to this project are:
MM (Money Maker) Detective Indicator (Start from 3865)
Custom Indicators for TMA-ADR Reversal Trading and BBMA (Get the latest indicators and EA here)
I strongly advise that everyone goes through the threads to read about the history of the project and how far we have come with development.
Credits: Robots4Me, Robot Trader, Parisboy, JVDA, Skyway, Nih98... e.t.c.
Summary of key posts on RBA Strategy
- 3865, 3867: Intro to the RBA Strategy
- 3892, 3898: Why ADR bands over centered MA
- 3914: Detail trading rules
- 3957, 3958, 3973: Intro to trade manager
- 4016: Notes on dashboard
- 4040: Notes on repainting
- 4050: Notes on scaling trades & MM
- 4054, 4085, 4099: Validation of strategy
- 4057, 4062: Notes on exit due to midline shift
- 4127: Entries, Repainting & ADR bands
- 4145, 4155: Notes on how signals work
- 4153: Dynamic Entries & Lot sizing
- 4171, 4173, 4174: Alternative exit options
Trading RBA Strategy
This strategy is built around the behaviour of price around midline of a centred TMA. Anyone that can code should be able to do this easily. Grab a centred TMA and follow the following steps: 
Indicators and EA
Download the Latest Indicators and EA
here
Indicator Disclaimer: This indicator responds to price movements. Therefore, the bands may slightly shift during the week. However, entry conditions often remain in place on D1. As long as you stick to scaling your trades from D1 signals, you will be fine. Avoid LTF until you understand how it works.
Rules
The name of the strategy evolved over time. I shortened it to a more conventional name for easy reference.
August 19 Update
The strategy has been modified slightly. The underlying principle of ADR bands remain the same. For full details about the new updates, read here, here and here.
Do not post until you have digested the threads connected. We now focus on H1 and H4.
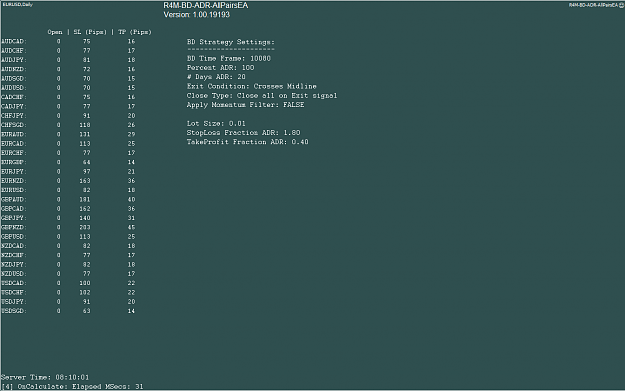
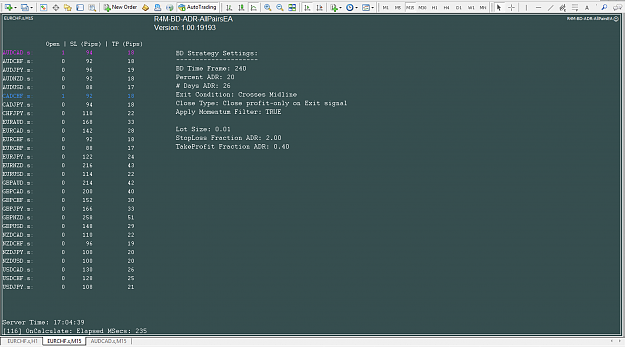
Attached Image (click to enlarge)
Introduction
To all traders, this thread is dedicated to a developing project the community (Robots4Me et al) have been working on. This thread is not for newbies. We will not entertain newbie questions. Make sure you have strong money management skills before you try this out. The market is unpredictable and it can swing against you by a thousand pips. This thread will only help you to identify buy and sell zones. It is not a magic method to become wealthy.
Robots4Me has been generous. He worked tirelessly to develop the indicators and EA. The rest of the community have been testing and giving quality feedbacks.
Purpose of thread
The purpose of this thread is to use the tools, and provide inputs for developing the tools to finished product. Market situations may change and the method may fail. So be careful. I am not here claiming to know everything or to have spent 1 million hours of screen time. Share your inputs and let's grow together in knowledge. All ideas are welcome.
When posting your screenshots, please remove all other indicators. We want clean charts. Only the indicator designed specifically for this thread is allowed.
How it started
The project started here.
The 2 main threads linked to this project are:
MM (Money Maker) Detective Indicator (Start from 3865)
Custom Indicators for TMA-ADR Reversal Trading and BBMA (Get the latest indicators and EA here)
I strongly advise that everyone goes through the threads to read about the history of the project and how far we have come with development.
Credits: Robots4Me, Robot Trader, Parisboy, JVDA, Skyway, Nih98... e.t.c.
Summary of key posts on RBA Strategy
- 3865, 3867: Intro to the RBA Strategy
- 3892, 3898: Why ADR bands over centered MA
- 3914: Detail trading rules
- 3957, 3958, 3973: Intro to trade manager
- 4016: Notes on dashboard
- 4040: Notes on repainting
- 4050: Notes on scaling trades & MM
- 4054, 4085, 4099: Validation of strategy
- 4057, 4062: Notes on exit due to midline shift
- 4127: Entries, Repainting & ADR bands
- 4145, 4155: Notes on how signals work
- 4153: Dynamic Entries & Lot sizing
- 4171, 4173, 4174: Alternative exit options
Trading RBA Strategy
This strategy is built around the behaviour of price around midline of a centred TMA. Anyone that can code should be able to do this easily. Grab a centred TMA and follow the following steps:
- Draw the center line of the centered MA (NIH Centered TMA, Interpolate = false, W1, half length = 1)
- Mark the ADR distance from the midline
- Check if the daily candle pokes and closes above the ADR from the midline (Check this at end of day)
- If step 3 is true, trade towards the midline
- Repeat step 1-4 once everyday at end of day (open of new daily candle)
- TP: Midline
- SL: x% of ADR distance from trade open price (I prefer 200%)
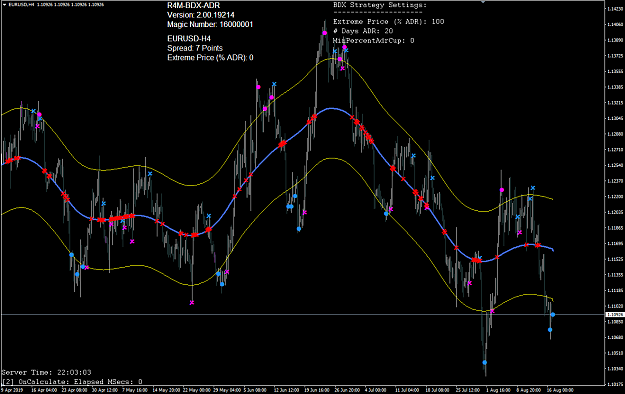
Attached Image
Indicators and EA
Download the Latest Indicators and EA
here
Indicator Disclaimer: This indicator responds to price movements. Therefore, the bands may slightly shift during the week. However, entry conditions often remain in place on D1. As long as you stick to scaling your trades from D1 signals, you will be fine. Avoid LTF until you understand how it works.
Rules
- Entries: Don't put all your eggs in one basket:
- You can scale in your trades as the signals show (Avoid LTF)
- Split your lots into pieces. For instance if all you want to put in to a trade cycle is 0.1, then split to 0.1/6 = 0.016 (pls is this even possible? Pls let me know of a good broker who can offer small lots)
- As each signal appear, take the trades at (Expected total lots/6)
- Set stop loss as 100% ADR. Each trade with it's own stop loss. The chances of price dropping another 100% ADR before retrace to midline is really small. Less than 5%. Would probably happen on black days (market crashes). Our stop loss will save the day
- Take profit at the midline
- Mobile stop loss and take profit
- We will have both hard stop loss and visual stop loss. Same for take profit
- Hard stop is the one set at the beginning of trade which ideally shouldnt move.
- Visual stop is the one the EA will execute based on price vs opposite bands and midline
- At the start of new week, new lines gets drawn.
- Here is the trick. The midline could immediately become a visual stop loss.
- If the midline is now below or above the price, ideally, we hope price will continue moving in our favour. However, if price reverses back to the midline, we get out of the trades. That's not a really good sign.
- The midline is our knife edge. If price touches the midline, either in profit or loss, exit
- Alternative approach is to use the opposite band as exit. In a buy trade, the upper band is exit. In a sell trade, the lower band is exit. Anytime price touches the bands, relative to the position we are trading (buy or sell), we exit
- Our stops and TP are therefore mobile and dynamic, responding to price movement and market structure.
- However, the stop loss placed at the beginning of the trade shouldn't move (I prefer to leave it there. I already estimated my risk before taking the trade anyway)
- Money
- I wouldn't trade beyond 0.01 if I don't have at least $10,000 on at least 1:100 margin
- Best, switch to a cent account. You will get enough room to play around
- Trade spacing
- Make trade spacing selectable. This is the distance between trades. We don't want to cluster all our trades on around the same price.
- This will provide some relief when we are in the grief of a falling knife.
- Trade spacing is defined by pips and should be a % of the ADR
- So if ADR is 100 and I am using a trade spacing of 25%, it means that I will take the next trade signal only if the signal appears at least 25 pips below the last trade.
- So trade spacing is based on pair ADR characteristics.
I don't have a crystal ball
- So I don't know if this strategy will be profitable.
- But general rule of thumb and experience shows we might make more than we will loose if done correctly
What the strategy isnt
- It is not a holy grail
- It is not a crystal ball
- It is not a get rich quick system
What Next
- Try the strategy
- Post charts
- Civil discussion
Thread Rules
- No fights, No arguments, No profanity
- Keep your language civil and respect the next person
- Read all the links above before commenting
- Do your home work. No one will answer questions that have been answered
- We wont entertain repainting questions (read the links on repainting)
- Do not post indicators or commercial content in this thread.
You can lose your money and you will probably lose it. So trade wisely. No indicator is better than your brain and 2 eyes.