Trading Made Simple(r)
I have named this thread as such because I learned so much from "Big E's" thread "Trading Made Simple" and I incorporated in some of the ideas and indicators he used, and some of how he used them. Furthermore, I would like to dedicate this thread to him, and may he rest in peace.
Although my templates do not include his main indicator which was the TDI, they do include other indicators that I find much easier to read than the TDI. For example, Big E (Eric) would talk about when the TDI started to bend, or arch, or flatten out, etc. as exit signals which I found to be way too subjective for me, so I eventually dropped it. And, he mentioned that he might drop it also because he could still trade very successfully without it. In other words, he didn't really need it either.
He also seemed to mostly like trading the 4 hour charts the best, and the daily charts to a lessor extent. He practically begged people to stop trading the lower time frames because you get whipsawed so much. I completely agree with him and suggest that you do the same. However, if you MUST day trade, I would suggest only day trading the 15 minute charts. But what you do is on you. These templates work just the same on any time frame.
For those of you who have not read Eric's thread "Trading Made Simple", I suggest you read it if you have not already.
Eric actually started talking about his method to a great extent in one thread, and then eventually created his own thread. Here they both are if you are interested:
Craig Harris Stochastics Method
https://www.forexfactory.com/showthread.php?t=211188
Trading Made Simple
https://www.forexfactory.com/showthread.php?t=291622
Big E PDFs:
Here are some .pdfs someone else made that contain of most of the significant things Eric wrote in those threads.
----------------------
Moving On...
I am creating this thread as a way of hopefully giving something back to this trading community, and to the many traders on this forum that have unselfishly given me the opportunity to learn so much from them. EVERY custom indicator I use (as far as I know), I downloaded for free from this forum.
The two templates that I am providing have evolved over the course of more than a decade. And, they may continue to evolve even more over time if we find useful things to add or change. Nothing here is set in stone, EXCEPT my way means always trading with the trend, and that means: at the start of what appears to be a new trend, or the resumption of a previous trend.
Now, what's UNUSUAL about my templates is that there is not just one, or just two or even 10 ways to trade them. There are MANY, and I am sure that there are more that I have not even uncovered yet.
Currently, I use 7 indicators to show me things like: where and when to enter and exit, where to place my stops, and sometimes where to place my profit target, market direction, turning points, trend, convergence, divergence, etc.
I will start off for now by explaining just two of the ways that I trade using the templates, but I suspect that over time other traders here will expose some of the other ways they discover, as will I also.
What you must understand is that what's presented, as it's presented, is NOT a trading system. A system has concrete rules with no variables. Methods don't. What I am presenting are trading methods, tips, and suggestions. Multiple trading methods about ways to enter and exit trades (with others likely to follow). The only concrete rules there are, are the ones that you decide to make and follow.
I have attached a zip file containing both templates and all indicators
I am sure that I have forgotten to mention or make clear lots things and so I'll add, correct, or clarify them as we go along.
And keep in mind, there is no Holy Grail trading system, and there is no winning without some losing.
At this point, I don't visit this forum every day. I trade, I own a business, and I travel quite a bit. I have done all 3 for more than 20 years and so I am often unavailable or too busy doing other things to be on the forum. If you have any questions for me, and you don't hear from me, I will be back as time permits.
My hope is that other traders will recognize the power of these templates and contribute even more ways to trade them, hopefully in ways even more effective than I have presented, and that they help traders make a lot more money trading the Forex.
- RobinHood
----------------------
Templates:
# 1 (Used on 4 Hour, Daily, Weekly and Monthly Charts)
# 2 (Used on 1 Hour and Lower Time Frame Charts)
* The only difference between the two templates is that Template # 2 includes a market Open and Close times indicator, which would mainly be used for intraday trading. Mine are preset with the London Open and Close times and the U.S. Open and Close times (based on Eastern Standard Time). They can easily be edited to suit your preferences and time zone. I like being able to visually see when different markets open and close.
* Personally, I only trade 4 hour charts and daily charts and I only use Template # 1.
----------------------
Templates and Indicators
----------------------
Template # 1
Indicators Used
Upper Window:
Yellow Line = 5 EMA, Shift + 2, Close
HMA Line (Hull Moving Average) = Period: 12, Method: 3, Price: 0 - Colors: Lime Green and Deep Pink
Heiken Ashi - Blue and Maroon
Synergy_APB - Doger Blue and Red
Bar Clock - DimGray
Magnified Market Price
Lower Window:
RSI 14 - Sienna/Brown
Stochastic - 8,3,3 - SlateGray (Thinner Line), Lime, Gold
Stochastic - 14,3,3 - SlateGray (Thicker Line), Blue, Red
50 Line - BlueViolet (I refer to it as Purple)
Template # 2 (Only Used for Intraday Trading or Chart Watching on lower Time Frames)
It is exactly the same as Template # 1 but it also includes an indicator called: JF_TradingTimes that shows you when particular markets open and close.
Note: None of these indicators repaint after the bar has closed.
--------------------------
Two Basic Trade Entry Methods Explained
Please Note: At first, it will seem like there are a lot of indicators and things to remember using these templates, but I can assure you that once you understand how each indicator works, and what the colors are telling you, it all becomes VERY simple. I will post some charts showing examples of each, and show some ways that I use them.
Indicator Colors
> Green and Blue Colors Always Mean "UP"
> Reddish and Orange-ish Colors Always Mean "Down"
> None of the Other Colors Used Have Any Meaning
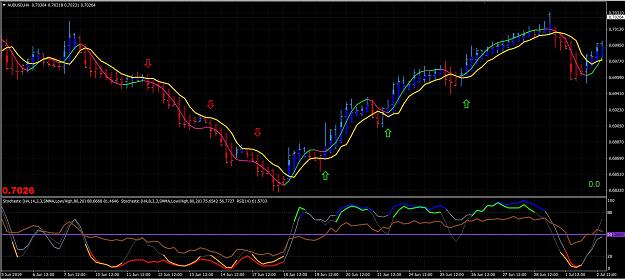
Crossover Trades:
1. The HMA Line is Lime Green and crosses above the Yellow Line for long trades OR the HMA Line and is Deep Pink and crosses below the Yellow Line for short trades.
2. The candles must have just changed from Dodger Blue/Blue to Red/Maroon for short trades or from Red/Maroon to Dodger Blue/Blue for long trades.
3. After both # 1 and # 2 above have occurred, preferably, you want to initiate a trade after the 1st bar has closed on the same side of the Yellow Line as the direction of the trade or on the 2nd or 3rd candle ideally. Entering any later than that is more risky.
4. The trade set-up bar is the 1st candle to cross over the Yellow Line AND is the opposite colors of the previous candles. Both bars must either be: Red/Maroon or Dodger Blue/Blue. Red/Maroon for short trades or Dodger Blue/Blue for long trades. The set-up candle must close before you enter a trade.
5. The 2 Stochastic Lines must be above, or crossing above the Purple 50 Line for longs OR below for shorts.
6. The RSI Line (Brown) must be on the same side of the Purple 50 line as the direction of the trade at the time of entry.
Continuation Trades:
A Continuation Trade is when there has already been a trade in that direction, but you were stopped out OR got out for some other reason and then you get another signal to enter in the same direction.
You can go long again if a bar turns back to Dodger Blue/Blue after being Red/Maroon or Red/Blue AND the Dodger Blue/Blue bar's close is above the Yellow Line and all other indicators agree.
You can go short again if a bar turns back to Red/Maroon after being Dodger Blue/Blue or Red/Blue AND the Red/Maroon bar's close is below the Yellow Line and all other indicators agree.
*Plus there are several others we'll talk about later in the thread.
Variation(s):
If all indicators imply long, and the Stochastics 8,3,3 (the thin SlateGray Line) retreats below the Purple 50 Line, then it crosses back above the Purple 50 Line and all indicators still imply long, you can enter long.
If all indicators imply short, and the Stochastics 8,3,3 (the thin SlateGray Line) retreats above the Purple 50 Line, then it crosses back below the Purple 50 Line and all indicators still imply short, you can enter short.
Plus, Remember This Too
There are MANY different indicators included or combinations of indicators included that you could use to enter trades. For example, you could use:
1. Just the Yellow Line
2. Just the HMA Line
3. Just one of the Stochastics, or a combination of both
4. Just the candles changing colors
5. Just the candles and the HMA Line
6. Just the HMA Line and the Yellow Line
7. Just the RSI crossing the 50 line
Etc. etc. etc.
--------------------------
Exit Methods
Just some of the possible ways...
1. Candles change to the opposite color(s)
2. RSI crosses the Purple 50 Line in the opposite direction
3. HMA Line turns the opposite color
4. A candle closes on the opposite side of the Yellow Line
5. One or both Stochastics cross the Purple 50 Line in the opposite direction
6. The HMA Line and the Yellow Line cross to the opposite direction
7. Stop Loss (including a trailing stop) gets hit
8. Profit Target is reached
9. The market stalls, or slows down to a crawl, or gets choppy
10. The trend changes direction
11. Plus many others, such as: Fibonacci spots, support and resistance areas, retracements, time of day, holidays, weekends, etc.
--------------------------
Stop Placement Methods
For Long Trades: Just below the low of the 2nd candle back behind the bar you entered on
For Short Trades: Just above the high of the 2nd candle back behind the bar you entered on
Note: You can put the stop at the high or low 1 candle back, but it will get hit much more often
--------------------------
Charts
--------------------------
Trading Tips:
When using the Crossover or Continuation methods for entries, it is best to enter on the 1st, 2nd, or 3rd candle after the HMA Line crosses the Yellow Line. Otherwise, it is usually better to wait for the next trade set-up. This is because, as Big E used to preach, most often candles only run the same colors for 3-8 bars.
When using the Crossover or Continuation methods for entries, ideally, you should only enter if BOTH Stochastic have crossed the Purple 50 Line (in the direction you are trading), or if one has crossed and the other is very close to crossing the 50.
You MUST wait for the set-up candle to close before you enter OR exit a trade, otherwise it may close the wrong color(s) and you don't want to trade that.
It's often much riskier to enter a new trade immediately after an exceptionally large bar. So it's not suggested that you do it.
Whenever you enter a trade, make sure that the last bar has closed on the same side of the Yellow Line as the direction you are trading in.
When the two Stochastics cross in unison (or very close together), it's usually a better than average trade set-up. But, you also need the other indicators to agree before you enter.
Always enter a stop loss immediately when you place a trade.
DON'T enter a new trade during the first hour after the open because the spreads are usually exceptionally wide. If I get a signal to enter on the Open, I enter just a few minutes BEFORE the Open when the spreads are still normal.
When you get a signal to enter on the 4 Hr. or Daily chart, drop down to the 1 min. or 5 min. chart and only enter when they are moving in the same direction as the entry signal.
Personally, I don't like to enter a trade when the previous bar closed in the opposite direction of my trade. I usually wait to enter until after a bar has closed in the direction of my trade before I enter. It's a momentum thing. So the rule is: The candle/bar IMMEDIATELY BEFORE the Entry Candle is called the Set-up Candle/Bar. The Set-up Candle/Bar must have closed in the same direction as the trade signal. For long trades, the Set-up Candle/Bar must have a higher close than the open. For short trades, the Set-up Candle/Bar must have a lower close than the open.
Trading Books I Suggest You Read:
Phantom's Gift
Way of the Turtle
More are coming!
--------------------------
In Conclusion...
This may sound harsh, but I really believe that if you cannot eventually learn to make money trading the Forex using these templates, then you should probably just give up trading the Forex.
Here is a document containing many of the most important posts from the thread (Thanks goes to krismitt who created it)
And Lastly...
If you are blatantly rude, obnoxious, insulting, or try to dissuade others in the thread with false information, you will be placed on IGNORE without warning (which means that you will no longer ever be able to post in the thread). No one wants those disruptions. We are here to help each other by teaching, learning, or both and so we need a nice, cordial environment that EVERYONE feels welcome in.
==============================================
ADDENDUM - 7/16/19
For those of you who may be struggling to get a good percentage of winning trades, here's what I suggest.
ONLY trade Continuation Trades on a 4 hour chart for now, and only until you perfect trading them. Do not take any Crossover Trades.
In my opinion, for people who are relatively new or inexperienced at trading OR have not yet been consistently successful at trading, Continuation Trades are easier to trade and more reliable than Crossover Trades (until you perfect them) because you are almost always jumping in on an ALREADY established trend, in the di-2019rection of the trend. You are "going with the flow". You are swimming down river. Both of which are easier than reversing course, which is what Crossover trades do.
I would also suggest (just while you are learning) that you place your stop just above the high of the candle 2 candles behind the candle you entered on for short trades and place your stop just below the low of the candle 2 candles behind the candle you entered on for long trades. If your risk tolerance is low, then place the stop 1 candle back, but you WILL lose more trades than if you place it 2 candles back, but you will also lose less per trade when you lose. It's up to you, but do one or the other, and whichever way you do it, do it consistently.
I would also suggest (just while you are learning) that whatever size your stop is in pips, that you also set a profit target for the same amount of pips. Set both immediately just after you place your trade. NO EXCEPTIONS. Make this a habit or you WILL live to regret not doing it.
Why I am suggesting that you trade this way (just until you get consistently profitable) is because it's like learning to ride a bicycle and using training wheels. Once you get good enough at trading this way, just as on a bicycle, you can take the training wheels off.
Here are some examples of Continuation Trades:
To Be Continued...
-----------------------------------------------------
One Way I Trade Stocks...
First off, let's get this issue out of the way. I use different indicators to trade stocks than I do the Forex. WHY? Because the exact same indicators are not always available on every trading platform, plus, it stimulates my mind to be honest.
I only make 2 types of trades when trading stocks. And they are the same 2 that I listed above for the Forex. Crossover Trades and Continuation Trades. Continuation Trades are much more reliable than Crossover Trades, plus there's always an obvious spot to put your stop.
What TRULY works in trading works on EVERYTHING. It does not matter whether it is a stock, metals, commodities, Futures, ETF's, or the Forex.
It does not matter what time frame you use. 1 minute charts or Yearly, every chart makes the same patterns, because they are all traded by humans, or robots that humans programmed.
In the chart below, I have intentionally hidden what the market is and what time frame is being traded, because neither one matter, The truth is ALWAYS the truth.
I have marked off 2 Crossover Trades, one Long and one Short on the chart. The Long trade is on the far left, and the Short trade is on the far right.
I am not going to hand feed all of my settings to everyone, because I believe in "teaching a man to fish, and not just giving a man a fish"
Entries:
1. Add at least 6 ema's to a chart, 3 shorter length relatively close together such as 3,5,7 or 4,6,9, whatever combination looks good to you as it mostly doesn't matter, just make all of them all under about 11 or so. I use these 3 to show me what the current time frame is doing, as in the smaller picture.
2. Then add 3 more ema's. Use something like 20,30,40 or 25,35,45, or 25,50,75 or whatever combination looks good to you as it mostly doesn't matter, just make all of them all under about 76 or so. I use these 3 to show me what the longer time frame is doing, as in the bigger picture.
*You can also add the long term ma's that that many stock traders use, like the 200 sma, etc., but I don't. I don't because price is too often far away from it which means that the 200 ma is basically irrelevant most of the time. They have a mantra: Only go long above the 200, and only go short below it. It's stupid if you ask me. Maybe that's why so many of them are losing traders.
3. Add the MACD to the bottom of the chart. Hide the shortest ema line by changing the color to "None" or to the same color as the background color. And add a horizontal line set to Zero. The ONLY purpose of using the MACD is this: When the MACD line is ABOVE 0, you can only take Long trades and when the MACD line is BELOW 0, you can only take Short trades.
4. Long Crossover Trades occur when the MACD line crosses above 0, AND the shortest ema crosses above the longest ema. Short trades are just the opposite.
5. In my opinion, every stock has a magic line that it mostly likes to respect, not always, just mostly. Above it, you can only be Long, and below it, you can only be short.
6. I do not implicitly trade Weekly Charts per se, I trade Daily charts. BUT, I only take trades on the Daily chart in the direction of the Weekly charts. You determine the direction of a weekly chart in the exact same way that you determine the direction of a Daily chart, same indicators, same everything. I also day trade nearly every day, and use the exact same settings, only then I use a 2 minute chart, but that's just my personal preference, any time frame will work. Use something you like.
Exits:
Exits, in my opinion can be very varied, just use something or some things that you have some confidence in.
1. I would NEVER stay in a Long trade when the MACD crosses below 0, and vice-versa for shorts.
2. Pick the crossing of 2 ema's. For example, when your shortest ema crosses above the 3rd shortest ema. You decide which two as everyone has a different level of tolerance when it come to giving money back when they are winning, or losing.
3. OR use some exit method that you already know and like.
* I have a lot of stock trading idiosyncrasies to add, and I will over time.
-----------------
1. Don't trade stocks with ugly charts.
2. Don't watch or read the financial news.
3. Don't go into trading chat rooms.
4. Trade what you see, not what you think.
5. Never have a bias as to the direction of a stock.
6. Never "marry" a stock.
7. Try to ride your winners until the indicators tell you to exit.
8. ALWAYS use and place a Stop Loss.
9. Learn to SMALL!!!
I have named this thread as such because I learned so much from "Big E's" thread "Trading Made Simple" and I incorporated in some of the ideas and indicators he used, and some of how he used them. Furthermore, I would like to dedicate this thread to him, and may he rest in peace.
Although my templates do not include his main indicator which was the TDI, they do include other indicators that I find much easier to read than the TDI. For example, Big E (Eric) would talk about when the TDI started to bend, or arch, or flatten out, etc. as exit signals which I found to be way too subjective for me, so I eventually dropped it. And, he mentioned that he might drop it also because he could still trade very successfully without it. In other words, he didn't really need it either.
He also seemed to mostly like trading the 4 hour charts the best, and the daily charts to a lessor extent. He practically begged people to stop trading the lower time frames because you get whipsawed so much. I completely agree with him and suggest that you do the same. However, if you MUST day trade, I would suggest only day trading the 15 minute charts. But what you do is on you. These templates work just the same on any time frame.
For those of you who have not read Eric's thread "Trading Made Simple", I suggest you read it if you have not already.
Eric actually started talking about his method to a great extent in one thread, and then eventually created his own thread. Here they both are if you are interested:
Craig Harris Stochastics Method
https://www.forexfactory.com/showthread.php?t=211188
Trading Made Simple
https://www.forexfactory.com/showthread.php?t=291622
Big E PDFs:
Here are some .pdfs someone else made that contain of most of the significant things Eric wrote in those threads.
Attached File(s)
Attached File(s)
----------------------
Moving On...
I am creating this thread as a way of hopefully giving something back to this trading community, and to the many traders on this forum that have unselfishly given me the opportunity to learn so much from them. EVERY custom indicator I use (as far as I know), I downloaded for free from this forum.
The two templates that I am providing have evolved over the course of more than a decade. And, they may continue to evolve even more over time if we find useful things to add or change. Nothing here is set in stone, EXCEPT my way means always trading with the trend, and that means: at the start of what appears to be a new trend, or the resumption of a previous trend.
Now, what's UNUSUAL about my templates is that there is not just one, or just two or even 10 ways to trade them. There are MANY, and I am sure that there are more that I have not even uncovered yet.
Currently, I use 7 indicators to show me things like: where and when to enter and exit, where to place my stops, and sometimes where to place my profit target, market direction, turning points, trend, convergence, divergence, etc.
I will start off for now by explaining just two of the ways that I trade using the templates, but I suspect that over time other traders here will expose some of the other ways they discover, as will I also.
What you must understand is that what's presented, as it's presented, is NOT a trading system. A system has concrete rules with no variables. Methods don't. What I am presenting are trading methods, tips, and suggestions. Multiple trading methods about ways to enter and exit trades (with others likely to follow). The only concrete rules there are, are the ones that you decide to make and follow.
I have attached a zip file containing both templates and all indicators
I am sure that I have forgotten to mention or make clear lots things and so I'll add, correct, or clarify them as we go along.
And keep in mind, there is no Holy Grail trading system, and there is no winning without some losing.
At this point, I don't visit this forum every day. I trade, I own a business, and I travel quite a bit. I have done all 3 for more than 20 years and so I am often unavailable or too busy doing other things to be on the forum. If you have any questions for me, and you don't hear from me, I will be back as time permits.
My hope is that other traders will recognize the power of these templates and contribute even more ways to trade them, hopefully in ways even more effective than I have presented, and that they help traders make a lot more money trading the Forex.
- RobinHood
----------------------
Templates:
# 1 (Used on 4 Hour, Daily, Weekly and Monthly Charts)
# 2 (Used on 1 Hour and Lower Time Frame Charts)
* The only difference between the two templates is that Template # 2 includes a market Open and Close times indicator, which would mainly be used for intraday trading. Mine are preset with the London Open and Close times and the U.S. Open and Close times (based on Eastern Standard Time). They can easily be edited to suit your preferences and time zone. I like being able to visually see when different markets open and close.
* Personally, I only trade 4 hour charts and daily charts and I only use Template # 1.
----------------------
Templates and Indicators
Attached File(s)
----------------------
Template # 1
Indicators Used
Upper Window:
Yellow Line = 5 EMA, Shift + 2, Close
HMA Line (Hull Moving Average) = Period: 12, Method: 3, Price: 0 - Colors: Lime Green and Deep Pink
Heiken Ashi - Blue and Maroon
Synergy_APB - Doger Blue and Red
Bar Clock - DimGray
Magnified Market Price
Lower Window:
RSI 14 - Sienna/Brown
Stochastic - 8,3,3 - SlateGray (Thinner Line), Lime, Gold
Stochastic - 14,3,3 - SlateGray (Thicker Line), Blue, Red
50 Line - BlueViolet (I refer to it as Purple)
Template # 2 (Only Used for Intraday Trading or Chart Watching on lower Time Frames)
It is exactly the same as Template # 1 but it also includes an indicator called: JF_TradingTimes that shows you when particular markets open and close.
Note: None of these indicators repaint after the bar has closed.
--------------------------
Two Basic Trade Entry Methods Explained
Please Note: At first, it will seem like there are a lot of indicators and things to remember using these templates, but I can assure you that once you understand how each indicator works, and what the colors are telling you, it all becomes VERY simple. I will post some charts showing examples of each, and show some ways that I use them.
Indicator Colors
> Green and Blue Colors Always Mean "UP"
> Reddish and Orange-ish Colors Always Mean "Down"
> None of the Other Colors Used Have Any Meaning
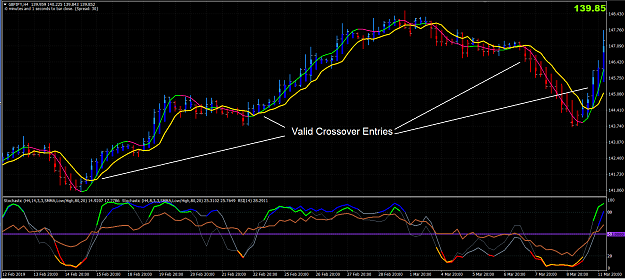
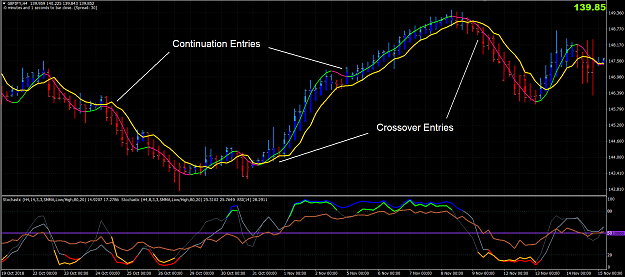
Crossover Trades:
1. The HMA Line is Lime Green and crosses above the Yellow Line for long trades OR the HMA Line and is Deep Pink and crosses below the Yellow Line for short trades.
2. The candles must have just changed from Dodger Blue/Blue to Red/Maroon for short trades or from Red/Maroon to Dodger Blue/Blue for long trades.
3. After both # 1 and # 2 above have occurred, preferably, you want to initiate a trade after the 1st bar has closed on the same side of the Yellow Line as the direction of the trade or on the 2nd or 3rd candle ideally. Entering any later than that is more risky.
4. The trade set-up bar is the 1st candle to cross over the Yellow Line AND is the opposite colors of the previous candles. Both bars must either be: Red/Maroon or Dodger Blue/Blue. Red/Maroon for short trades or Dodger Blue/Blue for long trades. The set-up candle must close before you enter a trade.
5. The 2 Stochastic Lines must be above, or crossing above the Purple 50 Line for longs OR below for shorts.
6. The RSI Line (Brown) must be on the same side of the Purple 50 line as the direction of the trade at the time of entry.
Continuation Trades:
A Continuation Trade is when there has already been a trade in that direction, but you were stopped out OR got out for some other reason and then you get another signal to enter in the same direction.
You can go long again if a bar turns back to Dodger Blue/Blue after being Red/Maroon or Red/Blue AND the Dodger Blue/Blue bar's close is above the Yellow Line and all other indicators agree.
You can go short again if a bar turns back to Red/Maroon after being Dodger Blue/Blue or Red/Blue AND the Red/Maroon bar's close is below the Yellow Line and all other indicators agree.
*Plus there are several others we'll talk about later in the thread.
Variation(s):
If all indicators imply long, and the Stochastics 8,3,3 (the thin SlateGray Line) retreats below the Purple 50 Line, then it crosses back above the Purple 50 Line and all indicators still imply long, you can enter long.
If all indicators imply short, and the Stochastics 8,3,3 (the thin SlateGray Line) retreats above the Purple 50 Line, then it crosses back below the Purple 50 Line and all indicators still imply short, you can enter short.
Plus, Remember This Too
There are MANY different indicators included or combinations of indicators included that you could use to enter trades. For example, you could use:
1. Just the Yellow Line
2. Just the HMA Line
3. Just one of the Stochastics, or a combination of both
4. Just the candles changing colors
5. Just the candles and the HMA Line
6. Just the HMA Line and the Yellow Line
7. Just the RSI crossing the 50 line
Etc. etc. etc.
--------------------------
Exit Methods
Just some of the possible ways...
1. Candles change to the opposite color(s)
2. RSI crosses the Purple 50 Line in the opposite direction
3. HMA Line turns the opposite color
4. A candle closes on the opposite side of the Yellow Line
5. One or both Stochastics cross the Purple 50 Line in the opposite direction
6. The HMA Line and the Yellow Line cross to the opposite direction
7. Stop Loss (including a trailing stop) gets hit
8. Profit Target is reached
9. The market stalls, or slows down to a crawl, or gets choppy
10. The trend changes direction
11. Plus many others, such as: Fibonacci spots, support and resistance areas, retracements, time of day, holidays, weekends, etc.
--------------------------
Stop Placement Methods
For Long Trades: Just below the low of the 2nd candle back behind the bar you entered on
For Short Trades: Just above the high of the 2nd candle back behind the bar you entered on
Note: You can put the stop at the high or low 1 candle back, but it will get hit much more often
--------------------------
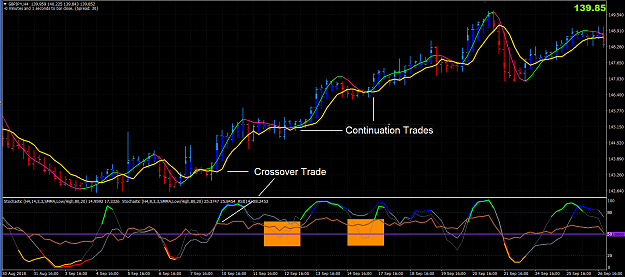
Charts
Attached Image (click to enlarge)
Attached Image (click to enlarge)
--------------------------
Trading Tips:
When using the Crossover or Continuation methods for entries, it is best to enter on the 1st, 2nd, or 3rd candle after the HMA Line crosses the Yellow Line. Otherwise, it is usually better to wait for the next trade set-up. This is because, as Big E used to preach, most often candles only run the same colors for 3-8 bars.
When using the Crossover or Continuation methods for entries, ideally, you should only enter if BOTH Stochastic have crossed the Purple 50 Line (in the direction you are trading), or if one has crossed and the other is very close to crossing the 50.
You MUST wait for the set-up candle to close before you enter OR exit a trade, otherwise it may close the wrong color(s) and you don't want to trade that.
It's often much riskier to enter a new trade immediately after an exceptionally large bar. So it's not suggested that you do it.
Whenever you enter a trade, make sure that the last bar has closed on the same side of the Yellow Line as the direction you are trading in.
When the two Stochastics cross in unison (or very close together), it's usually a better than average trade set-up. But, you also need the other indicators to agree before you enter.
Always enter a stop loss immediately when you place a trade.
DON'T enter a new trade during the first hour after the open because the spreads are usually exceptionally wide. If I get a signal to enter on the Open, I enter just a few minutes BEFORE the Open when the spreads are still normal.
When you get a signal to enter on the 4 Hr. or Daily chart, drop down to the 1 min. or 5 min. chart and only enter when they are moving in the same direction as the entry signal.
Personally, I don't like to enter a trade when the previous bar closed in the opposite direction of my trade. I usually wait to enter until after a bar has closed in the direction of my trade before I enter. It's a momentum thing. So the rule is: The candle/bar IMMEDIATELY BEFORE the Entry Candle is called the Set-up Candle/Bar. The Set-up Candle/Bar must have closed in the same direction as the trade signal. For long trades, the Set-up Candle/Bar must have a higher close than the open. For short trades, the Set-up Candle/Bar must have a lower close than the open.
Trading Books I Suggest You Read:
Phantom's Gift
Attached File(s)
Way of the Turtle
Attached File(s)
More are coming!
--------------------------
In Conclusion...
This may sound harsh, but I really believe that if you cannot eventually learn to make money trading the Forex using these templates, then you should probably just give up trading the Forex.
Here is a document containing many of the most important posts from the thread (Thanks goes to krismitt who created it)
Attached File(s)
And Lastly...
If you are blatantly rude, obnoxious, insulting, or try to dissuade others in the thread with false information, you will be placed on IGNORE without warning (which means that you will no longer ever be able to post in the thread). No one wants those disruptions. We are here to help each other by teaching, learning, or both and so we need a nice, cordial environment that EVERYONE feels welcome in.
==============================================
ADDENDUM - 7/16/19
For those of you who may be struggling to get a good percentage of winning trades, here's what I suggest.
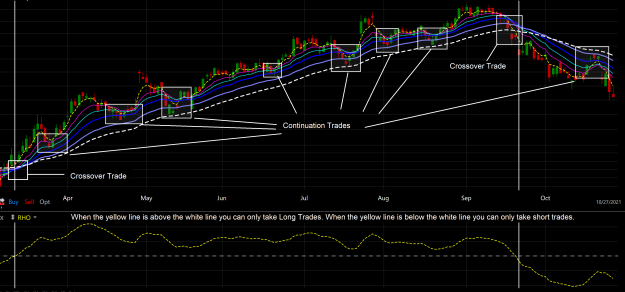
ONLY trade Continuation Trades on a 4 hour chart for now, and only until you perfect trading them. Do not take any Crossover Trades.
In my opinion, for people who are relatively new or inexperienced at trading OR have not yet been consistently successful at trading, Continuation Trades are easier to trade and more reliable than Crossover Trades (until you perfect them) because you are almost always jumping in on an ALREADY established trend, in the di-2019rection of the trend. You are "going with the flow". You are swimming down river. Both of which are easier than reversing course, which is what Crossover trades do.
I would also suggest (just while you are learning) that you place your stop just above the high of the candle 2 candles behind the candle you entered on for short trades and place your stop just below the low of the candle 2 candles behind the candle you entered on for long trades. If your risk tolerance is low, then place the stop 1 candle back, but you WILL lose more trades than if you place it 2 candles back, but you will also lose less per trade when you lose. It's up to you, but do one or the other, and whichever way you do it, do it consistently.
I would also suggest (just while you are learning) that whatever size your stop is in pips, that you also set a profit target for the same amount of pips. Set both immediately just after you place your trade. NO EXCEPTIONS. Make this a habit or you WILL live to regret not doing it.
Why I am suggesting that you trade this way (just until you get consistently profitable) is because it's like learning to ride a bicycle and using training wheels. Once you get good enough at trading this way, just as on a bicycle, you can take the training wheels off.
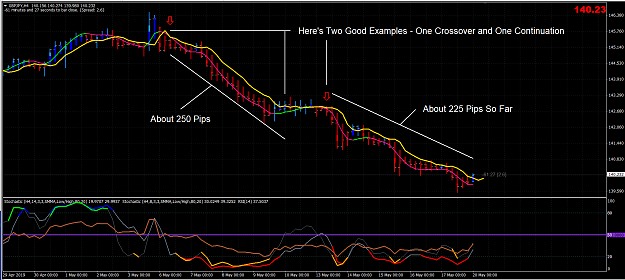
Here are some examples of Continuation Trades:
Attached Image (click to enlarge)
To Be Continued...
-----------------------------------------------------
One Way I Trade Stocks...
First off, let's get this issue out of the way. I use different indicators to trade stocks than I do the Forex. WHY? Because the exact same indicators are not always available on every trading platform, plus, it stimulates my mind to be honest.
I only make 2 types of trades when trading stocks. And they are the same 2 that I listed above for the Forex. Crossover Trades and Continuation Trades. Continuation Trades are much more reliable than Crossover Trades, plus there's always an obvious spot to put your stop.
What TRULY works in trading works on EVERYTHING. It does not matter whether it is a stock, metals, commodities, Futures, ETF's, or the Forex.
It does not matter what time frame you use. 1 minute charts or Yearly, every chart makes the same patterns, because they are all traded by humans, or robots that humans programmed.
In the chart below, I have intentionally hidden what the market is and what time frame is being traded, because neither one matter, The truth is ALWAYS the truth.
I have marked off 2 Crossover Trades, one Long and one Short on the chart. The Long trade is on the far left, and the Short trade is on the far right.
Attached Image (click to enlarge)
I am not going to hand feed all of my settings to everyone, because I believe in "teaching a man to fish, and not just giving a man a fish"
Entries:
1. Add at least 6 ema's to a chart, 3 shorter length relatively close together such as 3,5,7 or 4,6,9, whatever combination looks good to you as it mostly doesn't matter, just make all of them all under about 11 or so. I use these 3 to show me what the current time frame is doing, as in the smaller picture.
2. Then add 3 more ema's. Use something like 20,30,40 or 25,35,45, or 25,50,75 or whatever combination looks good to you as it mostly doesn't matter, just make all of them all under about 76 or so. I use these 3 to show me what the longer time frame is doing, as in the bigger picture.
*You can also add the long term ma's that that many stock traders use, like the 200 sma, etc., but I don't. I don't because price is too often far away from it which means that the 200 ma is basically irrelevant most of the time. They have a mantra: Only go long above the 200, and only go short below it. It's stupid if you ask me. Maybe that's why so many of them are losing traders.
3. Add the MACD to the bottom of the chart. Hide the shortest ema line by changing the color to "None" or to the same color as the background color. And add a horizontal line set to Zero. The ONLY purpose of using the MACD is this: When the MACD line is ABOVE 0, you can only take Long trades and when the MACD line is BELOW 0, you can only take Short trades.
4. Long Crossover Trades occur when the MACD line crosses above 0, AND the shortest ema crosses above the longest ema. Short trades are just the opposite.
5. In my opinion, every stock has a magic line that it mostly likes to respect, not always, just mostly. Above it, you can only be Long, and below it, you can only be short.
6. I do not implicitly trade Weekly Charts per se, I trade Daily charts. BUT, I only take trades on the Daily chart in the direction of the Weekly charts. You determine the direction of a weekly chart in the exact same way that you determine the direction of a Daily chart, same indicators, same everything. I also day trade nearly every day, and use the exact same settings, only then I use a 2 minute chart, but that's just my personal preference, any time frame will work. Use something you like.
Exits:
Exits, in my opinion can be very varied, just use something or some things that you have some confidence in.
1. I would NEVER stay in a Long trade when the MACD crosses below 0, and vice-versa for shorts.
2. Pick the crossing of 2 ema's. For example, when your shortest ema crosses above the 3rd shortest ema. You decide which two as everyone has a different level of tolerance when it come to giving money back when they are winning, or losing.
3. OR use some exit method that you already know and like.
* I have a lot of stock trading idiosyncrasies to add, and I will over time.
-----------------
1. Don't trade stocks with ugly charts.
2. Don't watch or read the financial news.
3. Don't go into trading chat rooms.
4. Trade what you see, not what you think.
5. Never have a bias as to the direction of a stock.
6. Never "marry" a stock.
7. Try to ride your winners until the indicators tell you to exit.
8. ALWAYS use and place a Stop Loss.
9. Learn to SMALL!!!
Always a Student, Never a Master - Emulate What Works