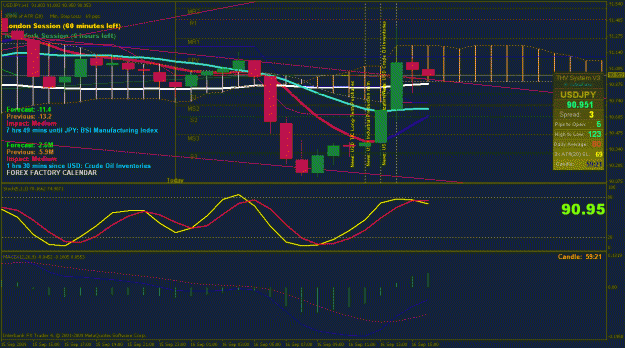
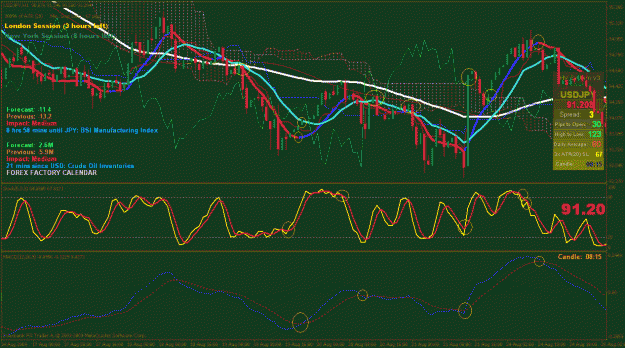
Here is the system that I use to trade USD/JPY, but really could be used with any pair. I am concentrating on USD/JPY at the moment though to refine this method and compile data on the correct signals.
Basically the system is compiled from:
1. A "true" MACD
2. Stock stochastics
3. A "Trend" indicator (EMA) Blue=Bull Trend, Red=Bear Trend
4. Ichimoku Cloud
5. ForexFactory Calendar Indicator
It generates fairly accurate longer term signals (1hr seems optimal).
Rule #1. Ride the Trend.
I have this indicator linked to email notification so I know immediately when the trend changes so I can get in early. This is especially important if the trend doesn't last longer than a few periods. Worst case scenario: break even or lose < 10 pips; but only if you get in early. I would not recommend trading against the trend with this system unless you're looking at other time frames in addition to the 1hr +...you WILL get burned.
Normally I let the new trend confirm itself by entering after the close of the first "trend change" period. After the trend is confirmed, the longer term trend (1hr +) has "offically" changed, and so far seems to persist for at least a full trading day in most cases.
Rule #2. Wait for MACD + Stochastics Confluence.
If you take a look at the example chart, you'll see that 95% of the time, a MACD cross occurs at the same time as a Trend change. We can anticipate this change by looking for stochastic confirmations. A stochastic hovering around 80, looking close to crossing when an MACD downward cross is immenent is indicative of a possible trend change. If the stochastic don't match up, the move could be very slight, adding up to a mild correction in the same trend instead of a change in direction.
The MACD included in this system is NOT the stock MACD indicator included with MT4. Use this one instead of the stock indicator.
Rule #3. Look where PA is in relation to the Ichimoku.
I use this indicator more as a indicator of where things wil go after the trend has changed. A trend's PA entering the Ichimoku cloud may encounter resistance, and be extra wary when PA begins to hit the top side of bottom of the cloud, as this is normally a definitive sign of support or resistance (good time to take profits, and get back into trend if it continues). I won't go into the specifics of this indicator, as it isn't a major player in identifying a trend change; there are many excellent articles explaining how to use this indicator.
Rule #4. Keep up with the latest News Releases.
You'll be amazed how news will trigger an already "ripe" setup. MACD and stochastics will be very close to crossing, and then an economic release will be the tipping point, sending the PA skyrocketing in whatever directions the other indicators were heading towards. Don't get burned by thinking that technicals alone will save the day. A big news release can be a knock out punch for what could have been a profitable trade.
Some of you may be familiar with this indicator. It displays the relavant upcoming news releases for a currency pair and is linked via RSS to the main ForexFactory caldendar.
In addition this these indicators, I also include candle patterns and support and resistance lines. I'll be including some of these in later "trade" posts.
Attached Image (click to enlarge)
Attached File(s)