It is interesting how a system vendor has allowed itself without asking to offer the system, it is right for free...
####################
Hi Gann-Experts,
here a nice indicator for trend analysis!
In the last days I read an interesting old book: "The Ultimate Breakthrough in Market Turning Point Detection" from Jeffrey Cuddy:
-----------------------------------
Description of The Ultimate Breakthrough in Market Turning Point Detection
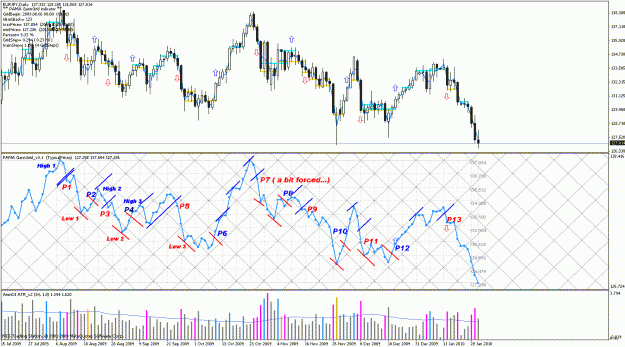
The 'first of its kind' unique trading book introduces the author's specialized turning point detection method, known as PAMA - the Pivotal Area of Market Analysis. Using a small but powerful arsenal of new technical techniques, PAMA monitors the market daily, then steps up its analytical focus when a potential turn zone is detected. Once that Pivotal Area is confirmed (which is done in real time) the method turns to eight conclusive price patterns and two original charting techniques to identify the ideal entry or exit day for your trade. The accuracy of PAMA's trade signals - recently described as 'coming close as is humanly possible to calling every major pivot point' - is unparalleled.
Jeff Cuddy's presentation of the PAMA Method is laid out in precisely the same sequence as his original creation (and subsequent application) of this brilliant trading idea.
- In Section I the inner working so the system are spelled out - each rule, price pattern and chart-based technique.
- Section II pits PAMA against the stock market. Walk-through examples illustrate the method and action trading the Dow from 1987 to 1995 (a period in which PAMA nearly doubled the return of 'buy and hold'.)
- Section III concludes the book with a detailed analysis of PAMA applied to Jeff Cuddy's current area of interest - the futures markets.
-----------------------------------
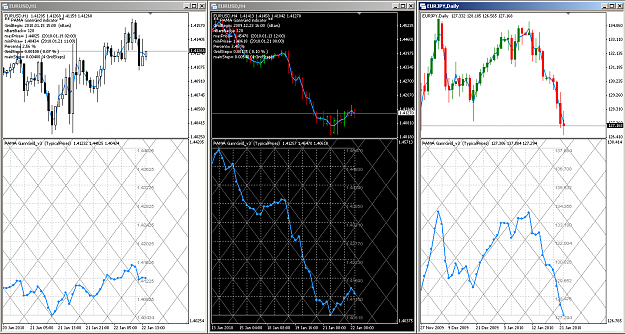
- I have tried to programe the grids using the default GridGann in Metatrader. If it gives visual problems after drawing the grids, restart the indicator.
- The main grid has default 36 squares between the high and low of the analysis interval, and the space between the GannGrids is default 8. You can draw all 36 grids, or only the main grids (every fourth).
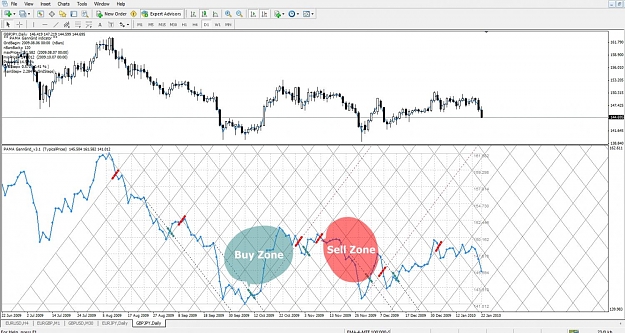
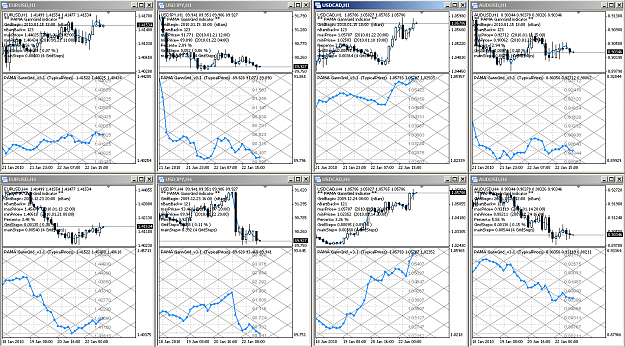
With this formula, we have for every pair or for every time frame, the same visual scale for trend analysis!
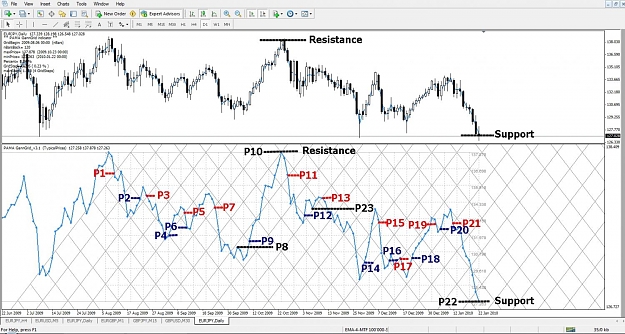
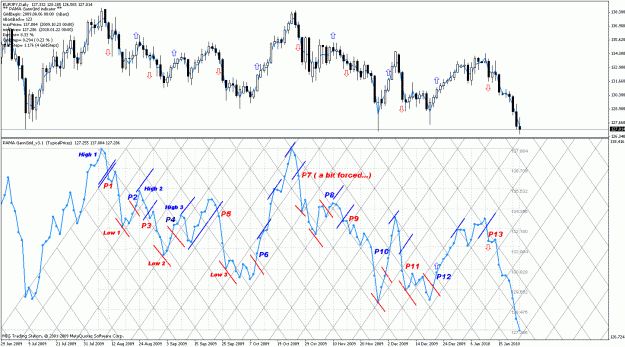
I think the indicator is very suitable for long term trading: you can print the charts, analyse the up and down channels, draw the trading levels and track the orders.
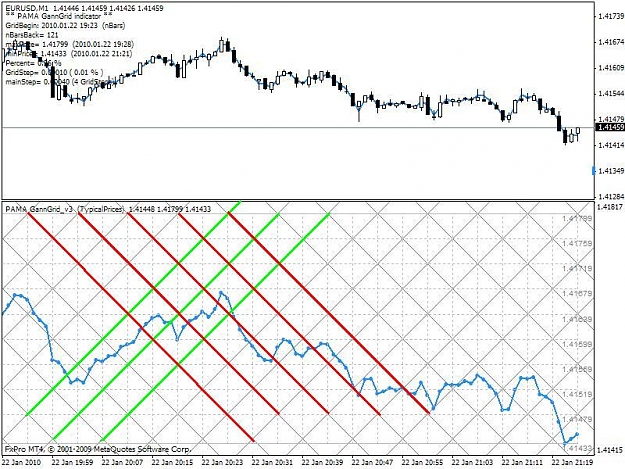
To develop a trading system with this indicator, first search the web for information about the GannGrids.
The basic idea is to determine if the prices reverse for example from an up-channel in a down-channel (45 channels). The stop losses can be placed four squares above the purchase price.
I would be glad if someone uses the system in practice and would like to report his experience!
.
####################
Hi Gann-Experts,
here a nice indicator for trend analysis!
In the last days I read an interesting old book: "The Ultimate Breakthrough in Market Turning Point Detection" from Jeffrey Cuddy:
-----------------------------------
Description of The Ultimate Breakthrough in Market Turning Point Detection
The 'first of its kind' unique trading book introduces the author's specialized turning point detection method, known as PAMA - the Pivotal Area of Market Analysis. Using a small but powerful arsenal of new technical techniques, PAMA monitors the market daily, then steps up its analytical focus when a potential turn zone is detected. Once that Pivotal Area is confirmed (which is done in real time) the method turns to eight conclusive price patterns and two original charting techniques to identify the ideal entry or exit day for your trade. The accuracy of PAMA's trade signals - recently described as 'coming close as is humanly possible to calling every major pivot point' - is unparalleled.
Jeff Cuddy's presentation of the PAMA Method is laid out in precisely the same sequence as his original creation (and subsequent application) of this brilliant trading idea.
- In Section I the inner working so the system are spelled out - each rule, price pattern and chart-based technique.
- Section II pits PAMA against the stock market. Walk-through examples illustrate the method and action trading the Dow from 1987 to 1995 (a period in which PAMA nearly doubled the return of 'buy and hold'.)
- Section III concludes the book with a detailed analysis of PAMA applied to Jeff Cuddy's current area of interest - the futures markets.
-----------------------------------
- I have tried to programe the grids using the default GridGann in Metatrader. If it gives visual problems after drawing the grids, restart the indicator.
- The main grid has default 36 squares between the high and low of the analysis interval, and the space between the GannGrids is default 8. You can draw all 36 grids, or only the main grids (every fourth).
With this formula, we have for every pair or for every time frame, the same visual scale for trend analysis!
I think the indicator is very suitable for long term trading: you can print the charts, analyse the up and down channels, draw the trading levels and track the orders.
To develop a trading system with this indicator, first search the web for information about the GannGrids.
The basic idea is to determine if the prices reverse for example from an up-channel in a down-channel (45 channels). The stop losses can be placed four squares above the purchase price.
I would be glad if someone uses the system in practice and would like to report his experience!
.
Attached Image (click to enlarge)
Attached File(s)