Up until I was given the honour of having a moderated forum I have been very reluctant to share the following information as it would no doubt be very confusing if I included it under a single thread. It is also a lot of work and not like I have too much on my plate already. However, to keep sitting on this knowledge isn't helping you...so I've decide to release it now.
I will warn you that this is a stheory that requires a lot of thinking and attention to detail. To trade it properly requires first learning some or all of the patterns and what they mean and then ensuring that the pattern is the pattern. I also say that I believe I have about 70% of it figured out, so that is why I call it a theory. The last 30% I haven't figured out is riding trades through small reversals....it doesn't hurt me but makes for more work during a trade.
The good news is that there are some easy basic patterns that I will explain first that are very easy to see...you can even see some of these stone cold drunk (not that I recommend trading that way). The easy patterns don't come up too often so knowing how to trade all the patterns will certainly enhance both entry and exit success. However, if an easy pattern appears...might as well trade it, eh!
I'll get us started in the easy patterns and this will allow you to look at the patterns yourselves.
The Stochastic Thread Theory was first formed from expanding Escalator to Pips. The theory was that if 4 time frames lined up, then what would happen with 18 stochastic lines on a single time frame?
For this we trade on only one chart. I recommend the 1H or 4H because we want to take advantage of the greater pip moves over time. I prefer the 1H as it fits my patience level better. I suggest starting out on the 4H because you will have more time to study the threads at close. The 30M and shorter time frames will be hard to trade because they don't leave much time for thought.
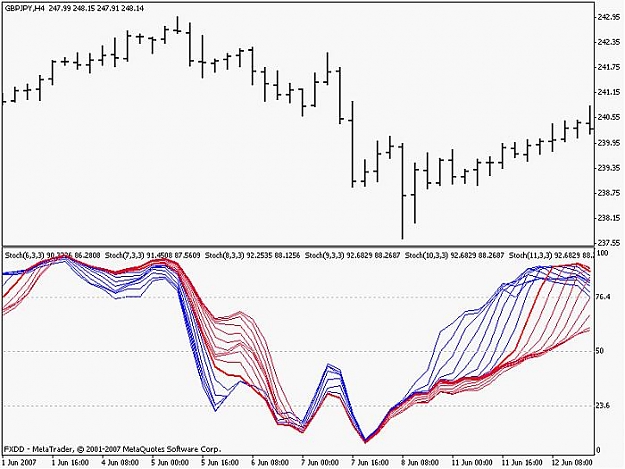
To set this up we need a 1H chart and 18 stochastic %K lines from 6 to 24...so 6,7,8,9,10,11,12,13,14,15,16,17,18,19,20,21,22,23,24 all in one indicator window. (So each stoch is 6,3,3; 7,3,3 and so on)
Colour 6 to 13 thin blue - these are our lower time frame stochastcis and will be called LTFS (Lower Time Frame Stochastics).
Colour 14 thick red - 14 plays an important role and you'll probably see why I switched to 14,3,3 after you see this. This is our Base Stochastic and is called naturally the BS line. So when it let's us done we can say, "That dang BS line messed me up!" with all honesty.
Colour 15-24 are thin red lines and are called HTFS (Higher Time Frame Stochastics)
Just in case you are wondering, this is MTF stochastics it is just not using different price charts but different stochastic periods.
What you should have is a nice rainbow on your chart like the one below.
I will warn you that this is a stheory that requires a lot of thinking and attention to detail. To trade it properly requires first learning some or all of the patterns and what they mean and then ensuring that the pattern is the pattern. I also say that I believe I have about 70% of it figured out, so that is why I call it a theory. The last 30% I haven't figured out is riding trades through small reversals....it doesn't hurt me but makes for more work during a trade.
The good news is that there are some easy basic patterns that I will explain first that are very easy to see...you can even see some of these stone cold drunk (not that I recommend trading that way). The easy patterns don't come up too often so knowing how to trade all the patterns will certainly enhance both entry and exit success. However, if an easy pattern appears...might as well trade it, eh!
I'll get us started in the easy patterns and this will allow you to look at the patterns yourselves.
The Stochastic Thread Theory was first formed from expanding Escalator to Pips. The theory was that if 4 time frames lined up, then what would happen with 18 stochastic lines on a single time frame?
For this we trade on only one chart. I recommend the 1H or 4H because we want to take advantage of the greater pip moves over time. I prefer the 1H as it fits my patience level better. I suggest starting out on the 4H because you will have more time to study the threads at close. The 30M and shorter time frames will be hard to trade because they don't leave much time for thought.
To set this up we need a 1H chart and 18 stochastic %K lines from 6 to 24...so 6,7,8,9,10,11,12,13,14,15,16,17,18,19,20,21,22,23,24 all in one indicator window. (So each stoch is 6,3,3; 7,3,3 and so on)
Colour 6 to 13 thin blue - these are our lower time frame stochastcis and will be called LTFS (Lower Time Frame Stochastics).
Colour 14 thick red - 14 plays an important role and you'll probably see why I switched to 14,3,3 after you see this. This is our Base Stochastic and is called naturally the BS line. So when it let's us done we can say, "That dang BS line messed me up!" with all honesty.
Colour 15-24 are thin red lines and are called HTFS (Higher Time Frame Stochastics)
Just in case you are wondering, this is MTF stochastics it is just not using different price charts but different stochastic periods.
What you should have is a nice rainbow on your chart like the one below.
Attached Image