Hi mzvega
Long time reader first time poster.
I just wanted to thank you for all the work you have put into this thread.
I also want to exend my thanks dljonesfan and evak. Their input and questions has helped a whole lot.
Right now I'm trying to wrap my head around the analysis part of AMVA.
I'm trying to understand activity references and how it affects the direction.
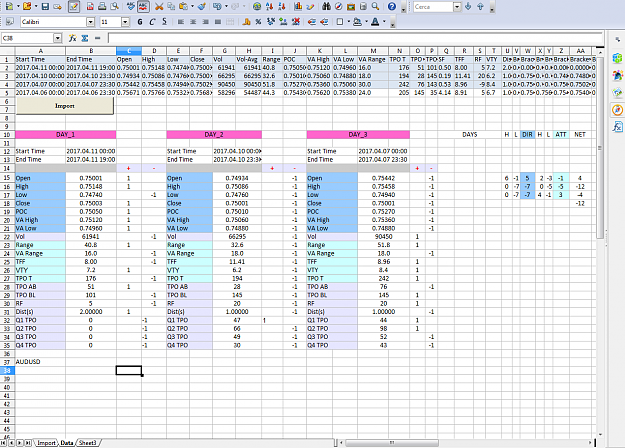
I have made several excel sheets that calculate NRI, Quadrant of close, direction flow, activity flow, attempted direction of POC and VA. To help me with this I have made several macros that move data into "database" excel sheets, and macros that update all calculation sheets. Currently I'm in the process of making a macro that let me go back in time and view data as if it were yesterday. Because of reasons.
Even if I will never get as good at AMVA as you I will at least have gotten fairly good at VBA, something that is often asked for in job adverts.
Anyway...
I write because I have noticed a glitch in bandungs indicator. When I export EURUSD data for TF 1, 3, 5, 10, 15, 20 days, I noticed that the end date for most were fine. I saw however that for TF 5day, 15 day and 20day the end date was wrong. If every TF had the correct end date of 2017.02.07, then the TF's I mentioned had the end date 2017.01.18. Very weird.
Is this something you have noticed before?
- Maybe I just shouldn't calculate flow for TF 3, 5, 10, 15, 20. As long as the 1day TF is okay.
- I this is a permanent problem I will also lose TPO count for Q1-Q4 for TF's with the problem. I hope it is just a temporary glitch.
- I can of course try to make my own profiles by importing OHLC data and do it with macros. My biggest problem will not be how to calculate the references, but where to aqquire the data.
Long time reader first time poster.
I just wanted to thank you for all the work you have put into this thread.
I also want to exend my thanks dljonesfan and evak. Their input and questions has helped a whole lot.
Right now I'm trying to wrap my head around the analysis part of AMVA.
I'm trying to understand activity references and how it affects the direction.
I have made several excel sheets that calculate NRI, Quadrant of close, direction flow, activity flow, attempted direction of POC and VA. To help me with this I have made several macros that move data into "database" excel sheets, and macros that update all calculation sheets. Currently I'm in the process of making a macro that let me go back in time and view data as if it were yesterday. Because of reasons.
Even if I will never get as good at AMVA as you I will at least have gotten fairly good at VBA, something that is often asked for in job adverts.
Anyway...
I write because I have noticed a glitch in bandungs indicator. When I export EURUSD data for TF 1, 3, 5, 10, 15, 20 days, I noticed that the end date for most were fine. I saw however that for TF 5day, 15 day and 20day the end date was wrong. If every TF had the correct end date of 2017.02.07, then the TF's I mentioned had the end date 2017.01.18. Very weird.
Is this something you have noticed before?
- Maybe I just shouldn't calculate flow for TF 3, 5, 10, 15, 20. As long as the 1day TF is okay.
- I this is a permanent problem I will also lose TPO count for Q1-Q4 for TF's with the problem. I hope it is just a temporary glitch.
- I can of course try to make my own profiles by importing OHLC data and do it with macros. My biggest problem will not be how to calculate the references, but where to aqquire the data.