{quote} Aren't those wicks the exact thing you want to see in a short
Ignored
No. You do not want to see wicks on the bottom of candles if you are short. Wicks mean buying pressure. At some point the bulls will win and the bears will give up and the market will rise.
Here is a follow up chart after I decided to get out. The bulls are winning.
Attached Image (click to enlarge)
If you are good at something, never do it for free--Joker
How I keep it simple: when trading the H4 chart timeframe, start the week by first looking at the W1 charts, if the W1 shows sideways market, check the range. Avoid trading narrow range sideways. if W1 is trending, then move on and look at D1, if D1 is trending in the same direction as W1, then trade H4 in the direction of both the W1 and D1. If D1 is in a 'correction' / retracement against the W1 trend, WAIT.... for D1 reversal
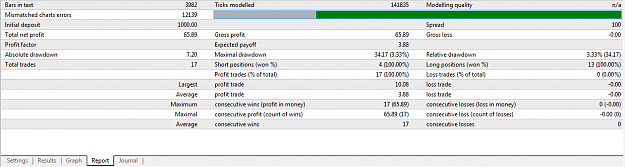
I am not sure this pair had been trending very well within my back testing period. But the result was good even though there were small number of setups available within three months time. I only select when H4 breakout with same direction with D1, W1.
Joined Nov 2015
|
Status: Member's sanity currently on AWOL
|8,885 Posts
"The TDI is not in the winning edge equation" and "The TDI is the heart of our method"
Above are two extracts from two post in Trading Made Simple. Both are done by Very Important Person(VIP) in this thread. Both members used an catchphrase that will be remembered for a long time. (At least by me) Only the catchphrase are used.
It is like a really bad itch that you just can't seem to scratch.
Both are contradicting each other
The Heikin-Ashi chart is constructed like a regular candlestick chart (except with the new values above). The time series is defined by the user--depending on the type of chart desired (daily, hourly, etc.). The down days are represented by filled bars, while the up days are represented by empty bars. Finally, all of the same candlestick patterns apply.
"The TDI is not in the winning edge equation" and "The TDI is the heart of our method" Above are two extracts from two post in Trading Made Simple. Both are done by Very Important Person(VIP) in this thread. Both members used an catchphrase that will be remembered for a long time. (At least by me) Only the catchphrase are used. It is like a really bad itch that you just can't seem to scratch. Both are contradicting each other Which is the right why to go?
Ignored
Both ways.
TDI is the heart of the method. It does not mean it will give you a winning edge. It has been stated many times that if you do not understand price action you will be in trouble.
If you are good at something, never do it for free--Joker
{quote} Do you mean this Sesamstrasse a lot of hindsight trading XM MT4.png;2163631 {image}
Ignored
Nope , I meant the stupid words I quoted before ..
"Quoting Tekkies
No Trader can manage a trade. A trader has only two choices on any chart 1. When to place an order. 2. When to close an order. Everything between those two points the market does the management. Don't wast time and try to make plans The market will always laugh at your plans.. "
Silly stuff , no doubt .
By the way..
Your positive contributions in this thread very rare ...
And these are the last words with you ..ignore.... just to make it clear ..
Wish you good success in trading ..
{quote} Maybe you missed this in the article you posted. Constructing the Chart The Heikin-Ashi chart is constructed like a regular candlestick chart (except with the new values above). The time series is defined by the user--depending on the type of chart desired (daily, hourly, etc.). The down days are represented by filled bars, while the up days are represented by empty bars. Finally, all of the same candlestick patterns apply. Read more: Heikin-Ashi: A Better...
Ignored
I have seen some videos on HA and they always say there will be little or no wicks at the top in a downtrend and vice versa..I must be doing it wrong for years...hmm
{quote} I have seen some videos on HA and they always say there will be little or no wicks at the top in a downtrend and vice versa..I must be doing it wrong for years...hmm
Ignored
It is entirely possible to do something wrong for a very long time. Sometimes for life. But if it works for you, by all means do not stop now!
If you are good at something, never do it for free--Joker
{quote} Nope , I meant the stupid words I quoted before .. "Quoting Tekkies No Trader can manage a trade. A trader has only two choices on any chart 1. When to place an order. 2. When to close an order. Everything between those two points the market does the management. Don't wast time and try to make plans The market will always laugh at your plans.. " Silly stuff , no doubt . By the way.. Your positive contributions in this thread very rare ... And thats the last words...
Ignored
Hi
We both agree on one aspect.
We both want to learn.
Now why the attack.
Why not say to me Tekkies this is way I do not agree with you.
Attack the post not the member.
...{quote} Both ways. TDI is the heart of the method. It does not mean it will give you a winning edge. It has been stated many times that if you do not understand price action you will be in trouble.
Ignored
Too much time is being spent on TDI and Stochastics, Too little time time on Price Action and Support/Resistance.
And no time spend on Money Management, Risk Management for entries and exits, When and How to Let Profits Run.
You need to find your WINNING EDGE and the TDI is not in the winning edge equation.
Honesty is a very expensive gift. You wont find it in cheap people.WBuffett
{quote} Hi big em ,what is your trade plan? teach us please .how you prepare before news or after news .what you consider ? how you decide to enter or go sideline?
Ignored
Hi Classy,
my trade plan is simple:
- when there is high impact news day, do not trade H1 intraday
- trade only after the news release and look at H4 and D1 charts only
- follow the higher timeframe W1, D1 and stay out of the intraday volatility created by the news.
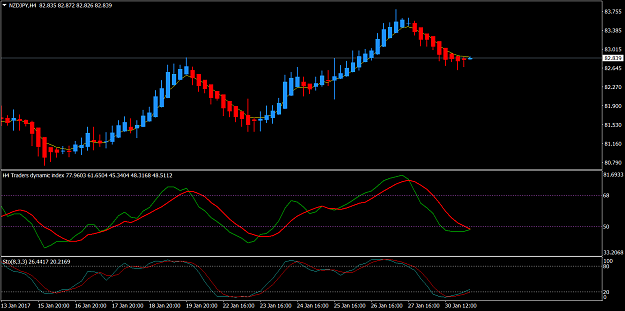
BOJ rate annoucement and policy statement did not change the market direction of the JPY pairs.
Honesty is a very expensive gift. You wont find it in cheap people.WBuffett
{quote} Hi emmanuel, Will you be able to share with me your approach on using the 10 EMA top down analysis for big picture planning? Thanks
Ignored
Hi,
I have posted many times on the use of 10EMA. Look for the posts using the keyword serach.
Tell me a currency pair and I will do a top down analysis this weekend to prepare for next week's trading.
Honesty is a very expensive gift. You wont find it in cheap people.WBuffett
{quote} Emm... You put up weekly charts to ask about trends or range without putting up a higher TF. I could say they are trending. But I could also say they are bull legs in a trading range. Your thoughts?
Ignored
Hi,
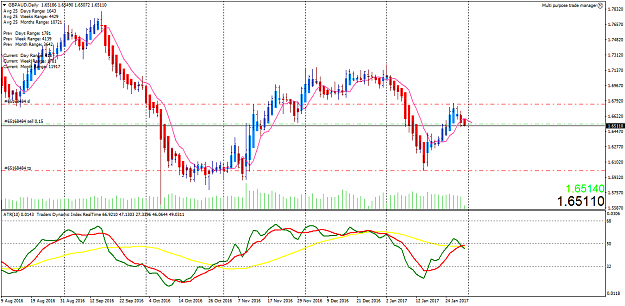
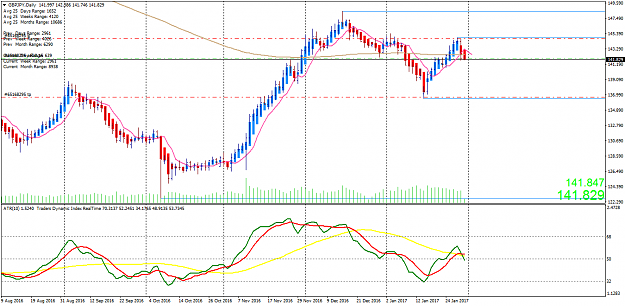
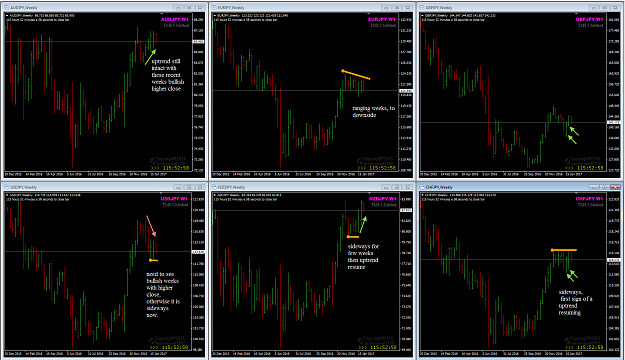
Looking at the November 2016 bull rally, that has come to a 'pause' and no clear sign of that bull rally continuing when I look at their weekly charts.
There is the top of that rally and we shall see how the JPY pairs will trade in the coming weeks. I prepare for more sideways range trading until there are consecutive weeks closing higher. If this happens, we can trade both buy and sell in the same week by catching the intra-week swings.
some added comments on my weekly charts.
Attached Image (click to enlarge)
Honesty is a very expensive gift. You wont find it in cheap people.WBuffett
{quote}the rule for Position Building is to add positions during the retracement when the 'trend' is confirmed seen in the higher timeframe
Ignored
Why add to a losing trade?
What would have stopped the pullback from going into a new trend up.
The higher time frame does not tell the lower time frame what to do.
The lower time frame always tell the higher time that is going to happen whether higher time frame like it or not.