Hi friends! I just started to learn the strategy, who can share the latest template of the strategy? I set out a template and post 24 and TDI Red Green.mq4 it is still true? Regards
Dear All, I m a new member of this thread. Just a quick note to say thank you to all dedicated senior (and not so senior) that spend all their times and efforts to help our newbie.
In fact I have spend at least a year or so in here , keep reading and still learning a lot! Trading Demo some six months or so then opening real small account. so far so good the balance growing slowly and steady.
I encounter a MT4 update ver 851 nightmare just this weekend! All the Synergy Pro indicator , TdI and some others no working at all. So Member BEWARE of the update!
Luckily, I have an old version on my Netbook so I copy the terminal itself and some ini from the config file to replace the updated one. It seems working so far! By the way must not forget to block all the auto update---mainly from the roaming file inside programdata and make sure change those file to read only.
I hope this help other that may have the same headache. I know nothing about the programming staff,!I just spend my whole day seeking for the solution and found this work. A tiny contribute if there is any help to u guys
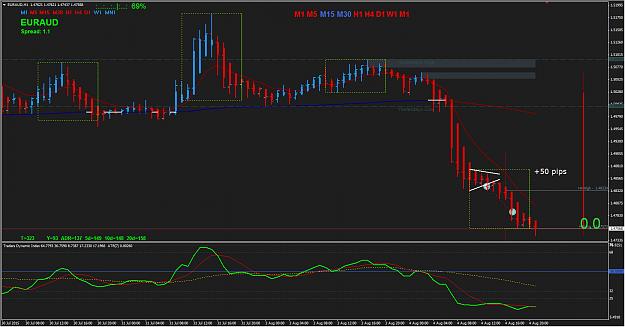
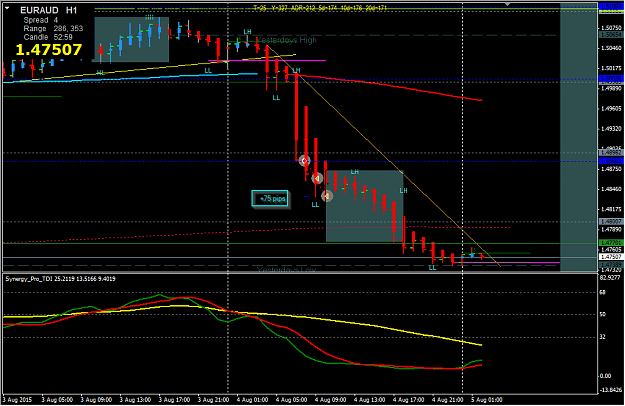
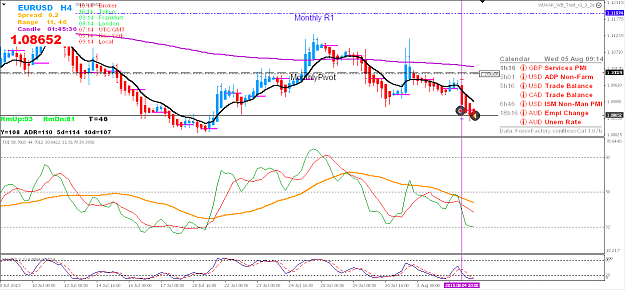
EURCAD D1 chart trading 3 August: The Big Picture is Monthly bullish, Weekly bullish. Here is one trade open today during Tokyo session open. As I won't have time to check every 4-hours, I simply place a limit order using 50% of the ADR. This should catch the retracement/correction which happens often. The technical Stop Loss is below June MN Low. {image} Will update this trade as market progresses.
Ignored
Hi ~
I read TMS has been a year, all repeat view 2 times
TMS see 2973 page X2
Craig Harris Stochastics Method see 226 page X2
Indeed very confusing
Now I want to chart a clean, abandon Index, focus on price action + Momentum
As I understand it, A +++
A +: PA (MC, IB, EB, OB, PB, etc.)
A +: SR
A +: TDI cross + APB 2
Currently I only know MN, W1 SR + H4 MC Breakout
APB 1 + 2 large entity, TDI cross 12-2,4-6
I wonder why omonisha only 200EMA, charts clean, not too many MN, W1 of the SR
I do not understand emmanuel7788 big picture planning, MN >> W1 >> D1 ??
In the end what can be specified MN, W1 bullish now? Bias
d1 primary trend: up "How do I determine the rise now?" MN, W1?
h4 intermediate trend: a double-dip or head and shoulders bottom HL
h1 short-term trend: Double Bottom
Attached Image (click to enlarge)
mn now MC
To determine how bullish or bearish Next
SR too much ~ chaos
THX
Do not understand English, forgive me with google translation
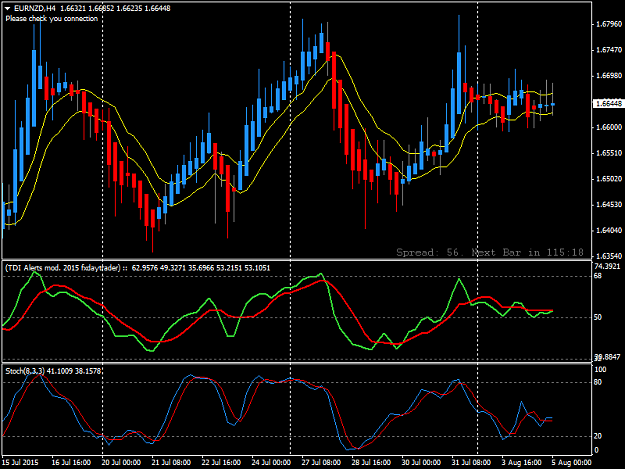
What for the indicator Synergy_APB? Can I use only TDI Red Green, Heiken Ashi and Stoch 8/3/3? It's enough?
Ignored
Yes, that's correct.
Synergy APB or Heiken Ashi (Personally I use Synergy_APB and the two yellow synergy Price Action Channel lines)
TDI Red Green (I use the version with push alerts but it's the same)
Stoch 8, 3, 3
4H chart
I try to keep it as close to Big E's original rules and trade it they way he did.
Start off simple, have less on your chart and keep things SIMPLE. Keep studying the past posts and read through Big E's PDF's over and over.
|
Joined Aug 2012
|
Status: Junior Member
|2 Posts
Hi, i m new here, i m trying to find the basic rules of entry and exit on this system, and since this thread going for years now can anyone tell me where to find the basic rules so i can undrestand what to look in charts and follow, thanks a lot
Hi, i m new here, i m trying to find the basic rules of entry and exit on this system, and since this thread going for years now can anyone tell me where to find the basic rules so i can undrestand what to look in charts and follow, thanks a lot
Ignored
New Introduction to Trading Made SimplePost#57,857
Honesty is a very expensive gift. You wont find it in cheap people.WBuffett
{quote} Hi ~ I read TMS has been a year, all repeat view 2 times TMS see 2973 page X2 Craig Harris Stochastics Method see 226 page X2 Indeed very confusing Now I want to chart a clean, abandon Index, focus on price action + Momentum As I understand it, A +++ A +: PA (MC, IB, EB, OB, PB, etc.) A +: SR A +: TDI cross + APB 2 Currently I only know MN, W1 SR + H4 MC Breakout APB 1 + 2 large entity, TDI cross 12-2,4-6 I wonder why omonisha only 200EMA, charts clean, not too many MN, W1 of the SR I do not understand emmanuel7788 big picture planning,...
Ignored
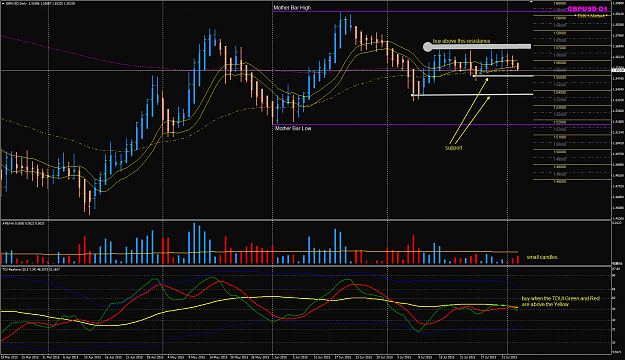
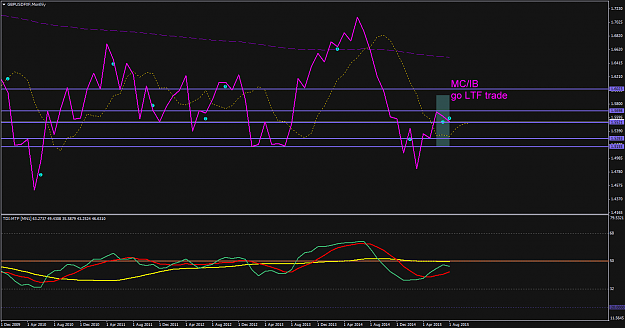
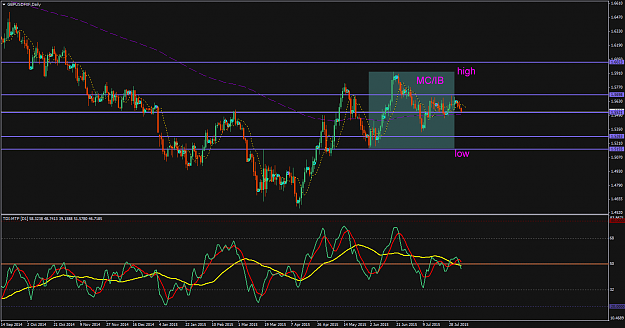
we do our top down analysis starting from the Monthly MN chart to identify where the historical price swing levels were and we use them and look at the price action in the lower timeframes Weekly W1 and Daily D1. Change your chart type to Line Chart on MN and you will see the price swings much easier. We only look the the MN price swings which are close to the current market price.
there is no MC (Master Candle) seen yet in our MN chart. A MC[3] must have 3 smaller candles within the high-low of the MC.
what we have is an MN Inside Bar and that June MN candle before that July Inside Bar is commonly known as the Mother Bar or the Mother Candle.
Attached Image (click to enlarge)
Honesty is a very expensive gift. You wont find it in cheap people.WBuffett
{quote} we do our top down analysis starting from the Monthly MN chart to identify where the historical price swing levels were and we use them and look at the price action in the lower timeframes Weekly W1 and Daily D1. Change your chart type to Line Chart on MN and you will see the price swings much easier. We only look the the MN price swings which are close to the current market price. there is no MC (Master Candle) seen yet in our MN chart. A MC[3] must have 3 smaller candles within the high-low of the MC. what we have is an MN Inside Bar and...
Ignored
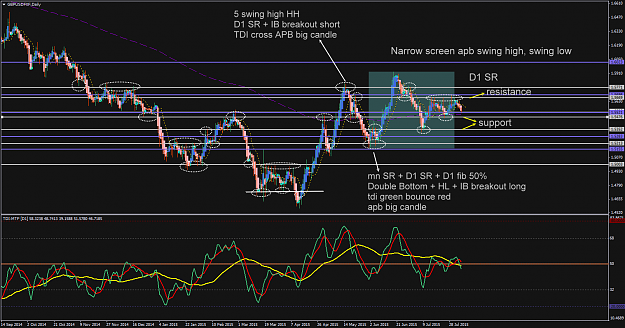
Will I know the current SR
1、mn, w1, Line Chart: to D1 or H4 waiting SR + TDI cross + APB 2
2、mb / ib: high-low: go LTF waiting SR + TDI cross + APB 2 breakout
3、Narrow screen apb swing high, swing low
Attached Image (click to enlarge)
Attached Image (click to enlarge)
Attached Image (click to enlarge)
My analysis methods do not correct or wrong? Please add
emmanuel THX
Do not understand English, forgive me with google translation
{quote} Good trading TSS. I caught some pips in the first round of move and slept during LO {image}
Ignored
Was good entry there, I was watching the downfall move, had small scalped during that fall, but didnt have a plan to run it through the course as the plan was only scalping, at LO took TMS continuation trade
I Have Learned to Take Some Losses to Make Profits