O
Thanks, will try this tomorrow and feedback.
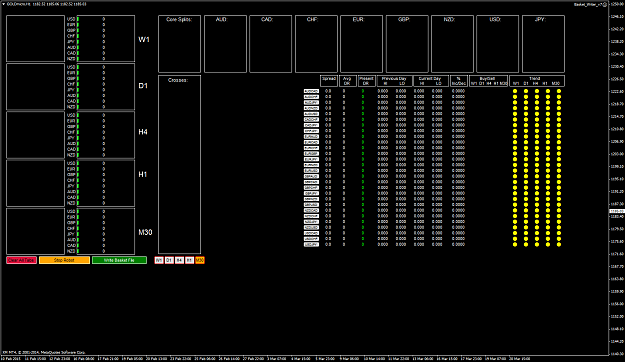
Disliked{quote} It does not matter which chart you load the ea on.... The H4 and D1 signals are simple SMA 12 line....which represents my middle line of BollBands.... Price below SMA 12 = Red arrow down and Price above SMA 12 = Green arrow up. (I presume you are referencing my earlier picture where the arrows were a bit confused.....this was a bug which i hope i have fixed)Ignored