DislikedPlease I am sorry to bother you; what is the best way to use the volume indicator? I know that one can take position if the volume is above the moving average line but I discovered that one can still have a fake out even with the right price action. For instance if one decide to go short when the price is below the 34 EMAs and the candle is strongly moving down with volume above the moving average, the next candle can reverse the trend. I read the manual where the original NVO is explained but the new indicator is different....Ignored
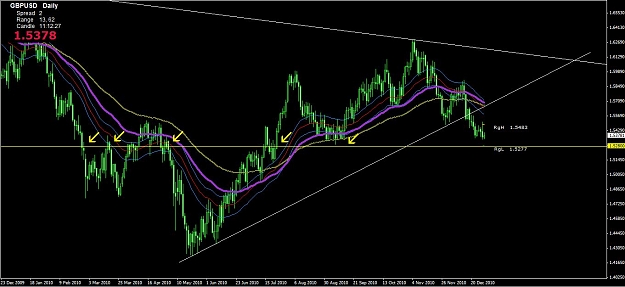
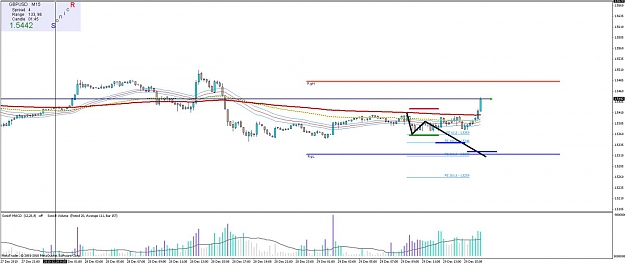
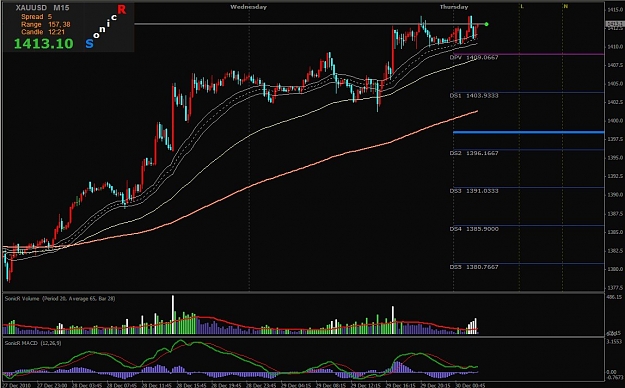
I have provided pic #1 with an example for a WAVE suggesting a downwards move. Note the black lines, PA moving down and volume increasing. Note the red lines, PA pumped back up with as little volume as they could get away with. Note the blue lines, another drive down starting with more than twice the average volume on the first candle off the highs. Now this has been for only a 30 pip move from the EP zone so far, but that might be because the PPMs just want it a bit lower to acquire longs in advance of a grand move up later....today or tomorrow. If the PPMs weren't in actuality thinking "make preparations for a long side move", such PA-volume might have resulted in a better run down.
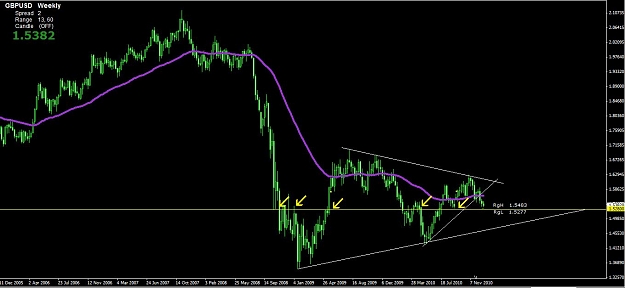
But this could still be made to drop some more by the London/US PPMs. However, price is around yesterday's lows. So the question is, will it break down for more downside, or will the PPMs use these lows to build their long positions? Pic #2 clearly shows peaks in relative volume at "relative lows" and at drives up off of the "relative lows" on the chart....much more so than any volume peaks at highs.
30 pips is a good trade.
Regards,
-TAH
Attached Image(s) (click to enlarge)