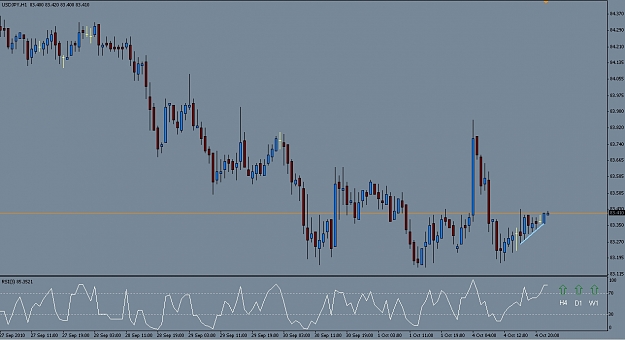
Dislikedwell, do you wait for the 3rd high/low? or just do the simple 50-level breakout?Ignored
yes sashasan,
long term target is 61.00% fibo retrace at 1.46xx or 76.4 % at 1.51xx
on the weekly tf.....
enclosure the chart ...
cheers
Attached Image (click to enlarge)