DislikedLet me answer questions on SR on this one post.
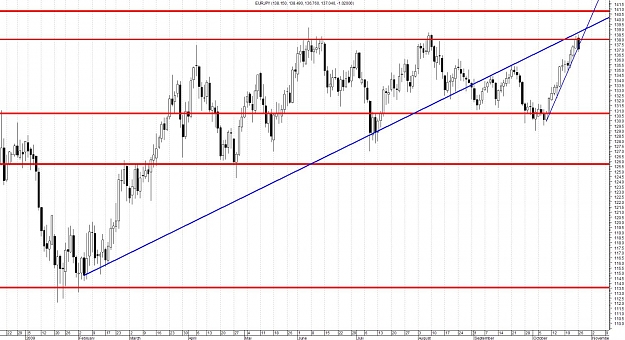
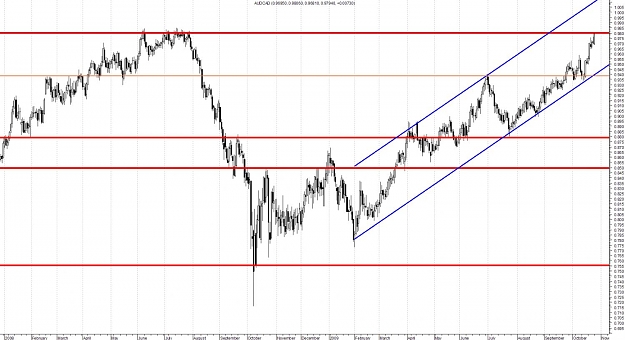
By Weekly SR at 1.068 I mean the SR that is drawn through CLOSES, usually I do it using the line chart because it is easier. This is what I understood reading Strat's thread that SR through closes, especially on larger timeframes like weekly and monthly, are very good SR lines. And until now (with my limited experience!) they proved to be very good SR lines.
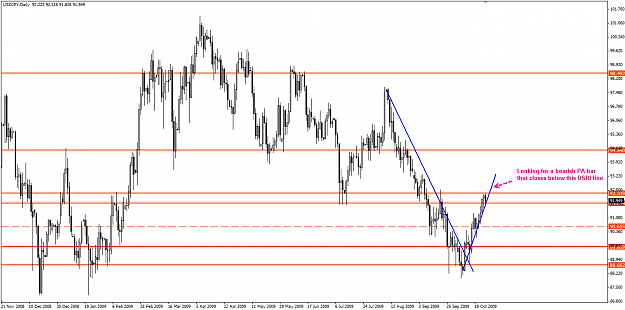
[i][b][font=Arial][color=blue]On Daily though I also use SR zones ala...Ignored
What I have noticed is that subsequent reactions to those levels will cause an instant bounce and be the end of the wick of a candle, so it looks like subsequent touches are candle wicks but if you go back in the chart you will find a closing price or several at that level.
I do however sometimes use wicks for trendlines, for no other reason than it stops me getting into too many false breakouts.