DislikedRemember why this is a theory...that dreaded 30% I haven't figured out yet.
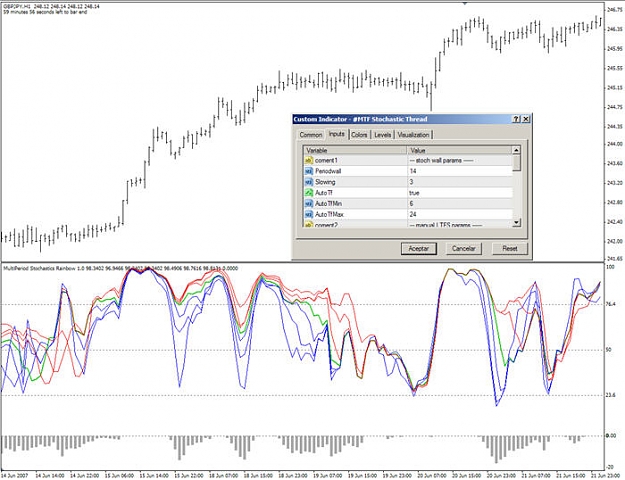
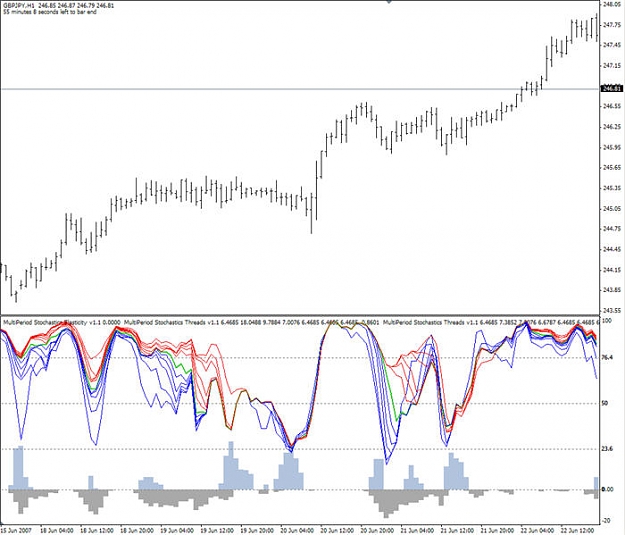
When we go from comb threads to a new rope usually something is going to happen. That usual thing is a price reversal. So don't wait for a peak if you see a new rope...trade when all (all) the stochastics converge.
Sometimes we just can't have a reason for a change in direction like on this chart. Having said that, if we stuck with the trade until the fishnet occurred we wouldn't have lost much if anything.
Like I said, this starts to take some thinking and studying and paying attention to all those threads. It gets way way way more interesting but I think for now I'll leave you with this to mull over for a while, it is a good start.Ignored
I look forward eagerly to the introduction of the patterns and other methods with MTF stoch.
I do have a question with the chart in the above post (not sure if the chart has been copied in my reply). Where you have the first blue line (where the peak has occured), from my observations of the stochs over the last 2 mths, the only time to know that it was a peak would be at the close of the next hour bar, which is the big up candle. Is this what you also see? Would your (hypothetical) entry have been at the close of the bar on the blue line, or the next bar? This answer will go a long way to my understanding of what you are seeing.
Regards,
K.