{quote} You are welcome.. No prob RH.. The one i use : TMA+CG 4C AA MTF TT.mq4 I also encounter VWMA+CG 4C AA MTF TT.mq4 There is one more indicator too from 'NIH98 Journal of Whatever' post 1 and you can apply all the different types of MA for it... The first 20 pages has many good information about how the OP traded and can find many really useful indicators mod by him.. I don't know him, but from his posts there and in this 'MM (Money Maker) Detective Indicator' thread,...
Hi there,
Does anyone uses MT5 with the original template that RH created in the initial post page 1.
I've downloaded the MT5 version that someone shared recently, Its appearances are different. I'd just like some clarification that they are configured the same.
Does anyone have the MT5 version for the smTMMS-RobinHoodDB_V2.2
Hi renkotop, you can find more about TMA from mladen post here.
Anyway, halflength is a technical term i found in TMA. If one uses half length 20 in a certain timeframe eg D1, it means 20 daily candles will be repainted when the current day candle closes (including the current running daily candle)
Hi there, Does anyone uses MT5 with the original template that RH created in the initial post page 1. I've downloaded the MT5 version that someone shared recently, Its appearances are different. I'd just like some clarification that they are configured the same. Does anyone have the MT5 version for the smTMMS-RobinHoodDB_V2.2 {image}
Ignored
Hi, did you get the template from this post 4464 ? Then it is the same setting, except that i use stochastics indicator that is provided by MT5, not an indie with different colours as shown in post1 for MT4..
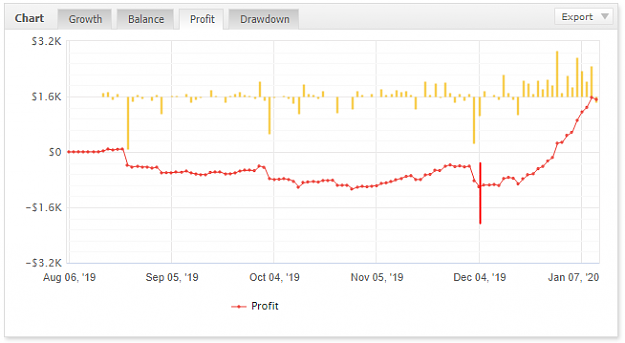
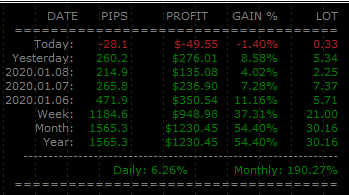
Wauw this system works well... Thank you so much for sharring. I started this system early in december after month of drawdown and now im back in profit using this simple system on the 4h chart on 28pairs.
I have added 2 images. 1st one showing my return from hell and the other one my result start this year.
Wauw this system works well... Thank you so much for sharring. I started this system early in december after month of drawdown and now im back in profit using this simple system on the 4h chart on 28pairs. I have added 2 images. 1st one showing my return from hell and the other one my result start this year. {image} {image}
Ignored
hi
I try this system before and I lose
I follow the rules but still lose my trades
you can show charts with your entry?
you post statistic but its not help for me
charts is more help
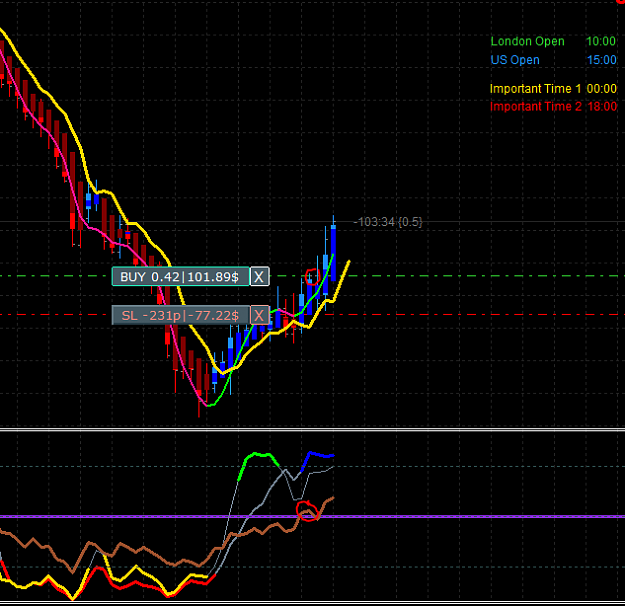
Here is the only current trade im in going into the weekend. Its a continues trade that i did today.
The candle is blue, the MA is green, both stocks are above. So i was waiting for a candle to close with the 3 candle rule where the RSI would close above the 50 line.
And it did, so i took the trade. It really is that simple.
I just follow the rules and dont enter to early. Wait for all indicators to show the right signal and the candle to close.
{quote} I'm using ea to manage my trades. I enter manually based on the rules and pa. I put more ephasis on a wide range bar crossing ema5s2 than I used to and i also use macd. I have bad weeks too, but they are getting fewer.
Ignored
Thanks for your response. Could you please share your Charts, if possible the indicators you are using additionally.
Wauw this system works well... Thank you so much for sharring. I started this system early in december after month of drawdown and now im back in profit using this simple system on the 4h chart on 28pairs. I have added 2 images. 1st one showing my return from hell and the other one my result start this year. {image} {image}
Ignored
Wow fantastic results. I also tried but wouldn't able to make positive pips, missing trades, SL hits continuing. Whenever I see H4 , Daily chart says different directions. When daily is in same H4 not coinciding with Daily and other rules. Probably due to Holidays in December or January beginning madness, Big Bank.
Still learning, but your results are amazing, there are some new traders here like me that would be helpful if you share some charts and ideas.
RH, Emma and other Old Traders who are successively trading with this system are tired responding so many repetitive questions. So please feel free to share any inputs.
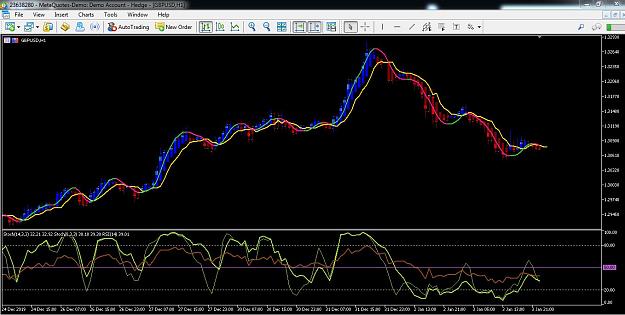
Sure will share what i can. Here is the only current trade im in going into the weekend. Its a continues trade that i did today. The candle is blue, the MA is green, both stocks are above. So i was waiting for a candle to close with the 3 candle rule where the RSI would close above the 50 line. And it did, so i took the trade. It really is that simple. I just follow the rules and dont enter to early. Wait for all indicators to show the right signal and the candle to close. Its hard to say more... its all in post no. 1 {image}
Ignored
Which Currency is this Chart and time Frame, do you compare with Higher time ?
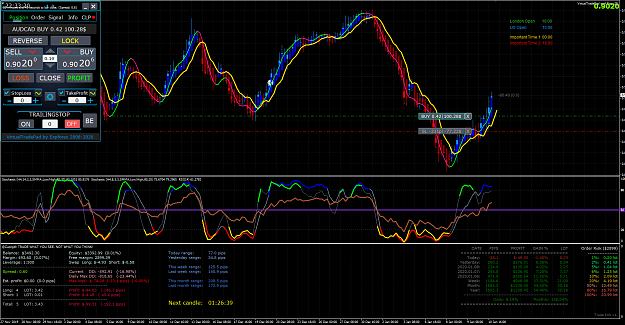
{quote} Here is my setup. Using the TMSr from 1st post, have just moved the text to the right instead of the original position. Then i use the Trading Information panel from MQL5 (free indicator) to show stats and i use it to set lot size. I use the 2% of balance as lot size. The trading panel is also from MQL5. Just easier to see positions. {image}
Ignored
Maybe a leverage of 1:500 would help me. Here in the UK we are limited to 1:50
Nice results tho.
{quote} Here is my setup. Using the TMSr from 1st post, have just moved the text to the right instead of the original position. Then i use the Trading Information panel from MQL5 (free indicator) to show stats and i use it to set lot size. I use the 2% of balance as lot size. The trading panel is also from MQL5. Just easier to see positions. {image}
Ignored
Thats so cool and Thanks for sharing, Here is the big question, I tried many currency pairs specifically almost on all GBP Pairs daily and H4 didnt not sync with D1.
In your case H4 says a classic buy But during the time D1 was Sell so i dint take the trade, same way I missed many, and I tried during the new year, almost all GBP pairs are matching with H4 and D1 and appears buy but all stopped out.
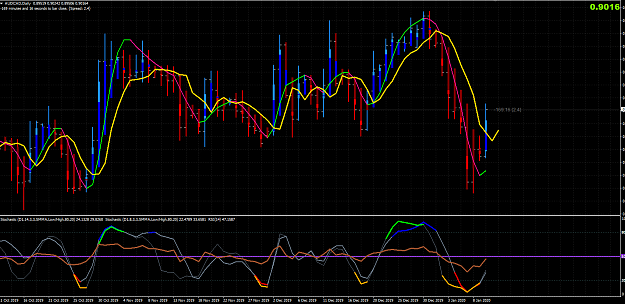
{quote} Thats so cool and Thanks for sharing, Here is the big question, I tried many currency pairs specifically almost on all GBP Pairs daily and H4 didnt not sync with D1. In your case H4 says a classic buy But during the time D1 was Sell so i dint take the trade, same way I missed many, and I tried during the new year, almost all GBP pairs are matching with H4 and D1 and appears buy but all stopped out. Please refer AUDCAD daily chart. {image}
Ignored
I would say you are so lucky whatever trades you entered without considering daily or weekly charts. So we all need to come up with some logic or exceptions how we can exclude higher time frames at some conditions. May be RH and Emma have different ideas.
{quote} I would say you are so lucky whatever trades you entered without considering daily or weekly charts. So we all need to come up with some logic or exceptions how we can exclude higher time frames at some conditions. May be RH and Emma have different ideas.
Ignored
I believe Emm says the stochs and RSI need to cross the 50 line within 3-4 candles of each other, anymore is more risky.
{quote} I believe Emm says the stochs and RSI need to cross the 50 line within 3-4 candles of each other, anymore is more risky.
Ignored
Yes thats correct , H4 as mentioned by test724 its a clean buy, but when considering D1 we should not trade. Very less chances if both are coinciding. I was trying a better continuation trade, but suddenly market changed and direction changed in Daily and exactly opposite direction on H4. Probably we may try 4H/12H combinations instead of 4H/D1.
{quote} Yes thats correct , H4 as mentioned by test724 its a clean buy, but when considering D1 we should not trade. Very less chances if both are coinciding. I was trying a better continuation trade, but suddenly market changed and direction changed in Daily and exactly opposite direction on H4. Probably we may try 4H/12H combinations instead of 4H/D1.
Ignored
Did I read somewhere that daily stochs and RSI just needs to be above 20 or below 80 for a valid trade on the H4?