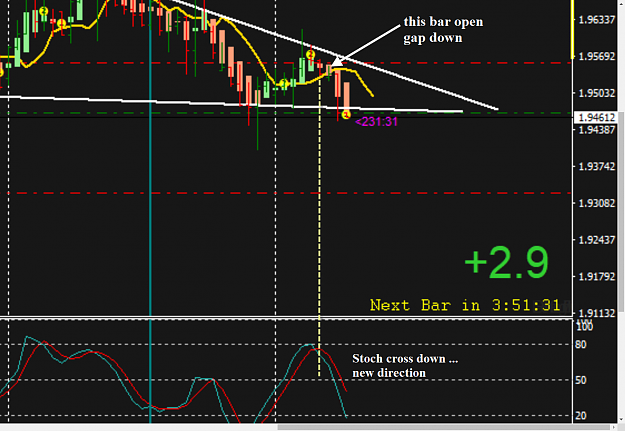
{quote} Nice! did you notice the price gap? beware of price gap and study how the TDI response to the gap - previous bar Close and current bar Close. {image}
{quote} Hope and Pray huh? You risk your whole demo account for 5 pips LMAO. If you had a real account you would have closed these trades when you were down 100 pips each on your sells. Cmon on Doc... You're a joke Speak to me when you're on my level. {image}
Ignored
Thank you so much for showing your concern about my account! However, it appears you may lack the ability to properly assess account status. The whole account has never been even remotely close to risk of being blown.
You do not know how many dollars I am willing to give up on a position, therefore, your conjecture of closing trades at 100 pips down is far from correct. Not only is the unrealized loss considerably less than what I have for an actual acceptable loss, it is only a portion of realized PROFITS, which means no part of my original stake is being risked.
In addition, my used margin has also been a small percentage of the account.
So except for YOUR specific bias about what YOU would do under these circumstances, your insights are not applicable.
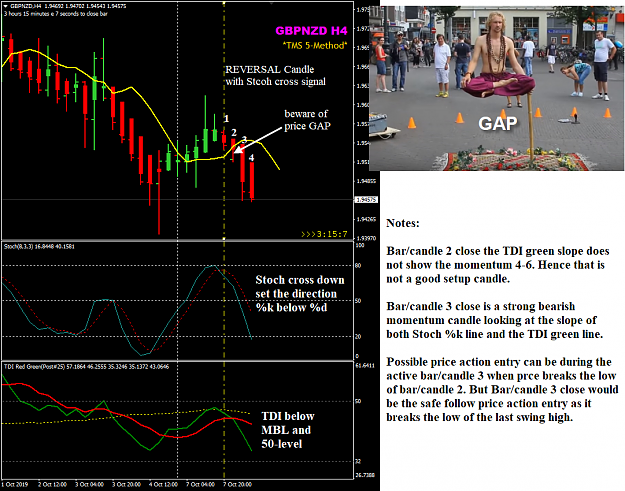
{quote} see my chart and comments. there is price open gap down like in the member chart. pay attention to details ... bar/candles 1 and 2. {image} Edit: here zoom in to the members's neoaus chart for details, note the reversal candle and the Stoch cross signal... {image}
Ignored
Never mind Emmanuel.
Members need to compare what you highlight in yellow against what you post and make their own conclusion.
{quote} Never mind Emmanuel. Members need to compare what you highlight in yellow against what you post and make their own conclusion. -
Ignored
Well, Tekkies
I have been saying this over and over again, members must learn to read all the OP's posts in this thread starting with Post#1 right up to Post#12,912 and do as what the OP has written.
"Do not think you can trade with us without reading the thread and taking notes. READ & STUDY."
Learn EVERYTHING from the OP by following his trading journey here in Forex Factory. Master the 5-Method and you will know if you can make money by developing your own winning system that fits you.
Honesty is a very expensive gift. You wont find it in cheap people.WBuffett
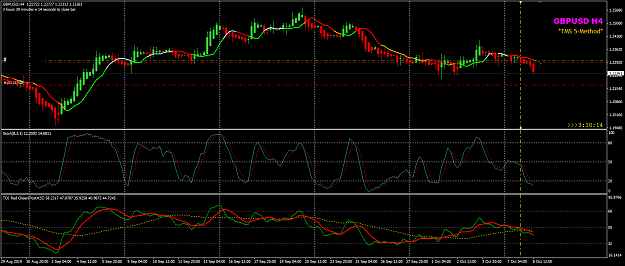
{quote} GBPUSD Oct 08 H4 that first setup did not run and the HA candles were small but close below the 5EMA. another H4 entry opportunity ... both the Stoch and TDI looks good in the same direction. {image}
Ignored
GBPUSD Oct 08 H4 trade now moved to BE and see how far it will go...
Attached Image (click to enlarge)
Honesty is a very expensive gift. You wont find it in cheap people.WBuffett
the Stoch show a cross Up signal when Thursday close.. this it the new Stoch direction and now showing crossing its 50-level is good Based on Thursday Oct 03 close, I started my MEME buy. on my big picture chart, I see potential for a move higher but watch out for reaction around the BRN 06800 and risk a bearisg reversal back to the dominant primary trend. {image} {image}
Ignored
I am wondering about the status of your MEME buy. Is there an update?
{quote} Anyone go to my second post and use the Traders Dynamic Index with those setting 13,0,2,0,7,0 and do what Emmanuel did on M15 chart Post 98,054 two bottom sub-windows, I will never again post in this thread. When they cannot that will include yourself, you pack your bags and leave. Deal? Any takers? ------ As to your other post's. --- "Stop living in the past." That is a new one, Emmanuel. Remarkable you made such a post. Well you surely like to go back, way...
Ignored
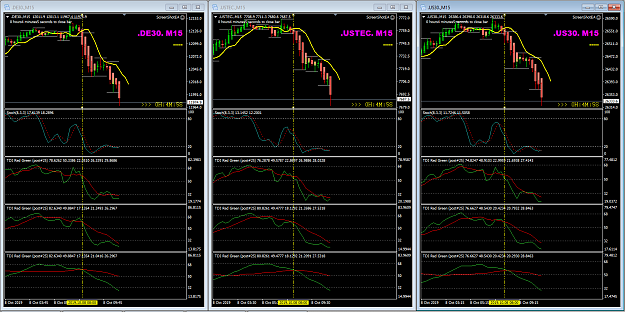
Tekkies wrote: Anyone go to my second post and use the Traders Dynamic Index with those setting 13,0,2,0,7,0 and do what Emmanuel did on M15 chart Post 98,054 two bottom sub-windows, I will never again post in this thread. When they cannot that will include yourself, you pack your bags and leave. Deal? Any takers?
------
here done, see below:
same Traders Dynamic Index to show different extended period duration in sub-windows 2, 3 and 4. Sub-window 1 is the Stoch(8,3,3) for the chart timeframe M15.
Attached Image (click to enlarge)
Honesty is a very expensive gift. You wont find it in cheap people.WBuffett
Training Char - Going south (short). Even though it's candle #3 it looks strong for a trade entry... USD/JPY 4hr. {image}
Ignored
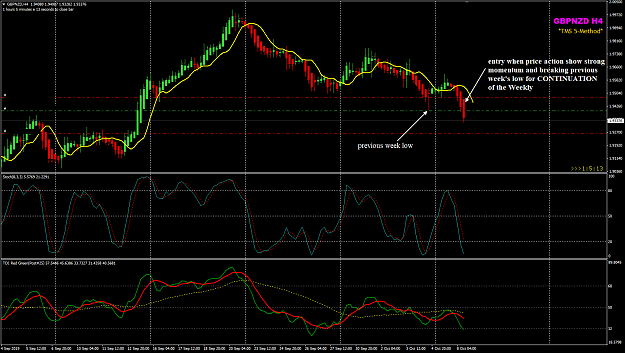
GBPNZD Oct 08 H4 London session
Even though it is candle#4 there is price action with strong bearish momentum to make an entry, price breaks the previous week's low for a continuation of the Weekly reversal candle.
Attached Image (click to enlarge)
Edit.
Weekly view:
Attached Image (click to enlarge)
Honesty is a very expensive gift. You wont find it in cheap people.WBuffett
{quote} Thank you so much for showing your concern about my account! However, it appears you may lack the ability to properly assess account status. The whole account has never been even remotely close to risk of being blown. You do not know how many dollars I am willing to give up on a position, therefore, your conjecture of closing trades at 100 pips down is far from correct. Not only is the unrealized loss considerably less than what I have for an actual acceptable loss, it is only a portion of realized PROFITS, which means no part of my original...
{quote} Tekkies wrote: Anyone go to my second post and use the Traders Dynamic Index with those setting 13,0,2,0,7,0 and do what Emmanuel did on M15 chart Post 98,054 two bottom sub-windows, I will never again post in this thread. When they cannot that will include yourself, you pack your bags and leave. Deal? Any takers? ------ here done, see below: same Traders Dynamic Index to show different extended period duration in sub-windows 2, 3 and 4. Sub-window 1 is the...
Ignored
Maybe I missed something, but the task was to
Quoting Tekkies
Disliked
use the Traders Dynamic Index with those setting 13,0,2,0,7,0
Ignored
It is impossible for the lower TDI plots on that M15 chart to have those settings. Those settings can produce only the TDI plot in the subwindow immediately below the stochastic.
There are only two ways to get the other two TDI plots on the M15 chart. !. Use a different TDI indicator that uses a different algorithm for the calculations for the plots while using the given values for the settings. 2. Use the same TDI indicator but use settings with values other than those that were listed.
You can solve this riddle for us by simple posting the TDI indicator and the settings that you used for the bottom TDI sub windows.
{quote} Maybe I missed something, but the task was to {quote} It is impossible for the lower TDI plots on that M15 chart to have those settings. Those settings can produce only the TDI plot in the subwindow immediately below the stochastic. There are only two ways to get the other two TDI plots on the M15 chart. !. Use a different TDI indicator that uses a different algorithm for the calculations for the plots while using the given values for the settings. 2. Use the same TDI indicator but use settings with values other than those that were listed....
Ignored
the same default original setting as what Tekkies wrote.
use the Traders Dynamic Index with those setting 13,0,2,0,7,0
now we wait for Tekkies to respond.
Honesty is a very expensive gift. You wont find it in cheap people.WBuffett
{quote} the same default original setting as what Tekkies wrote. use the Traders Dynamic Index with those setting 13,0,2,0,7,0 now we wait for Tekkies to respond.
Ignored
You got me. Damit Emmanuel now I must keep on posting in this thread. How could you be so mean.
------
It is not the TDI indicator from TMS post#25. It is not possible to draw those lines in Post 98,115 sub window 2,3. using these settings 13,0,2,0,7,0.
The MQ4 code inside that TDI indicator won't allow it. RSI_Period = 13; RSI_Price = 0;
VolaBand = 34; RSI_Price_Line = 2; RSI_Price_Type = 0; Trade_Signal_Line = 7; Trade_Signal_Type = 0;
-----
for(int i=limit; i>=0; i--)
{
RSIBuf[i] = (iRSI(NULL,0,RSI_Period,RSI_Price,i));
MA = 0;
for(int x=i; x<i+VolaBand; x++) {
RSI[x-i] = RSIBuf[x];
MA += RSIBuf[x]/VolaBand;
}
UpZone[i] = (MA + (1.6185 * StDev(RSI,VolaBand)));
DnZone[i] = (MA - (1.6185 * StDev(RSI,VolaBand)));
MdZone[i] = ((UpZone[i] + DnZone[i])/2);
}
for(i=limit-1;i>=0;i--)
{
MaBuf[i] = (iMAOnArray(RSIBuf,0,RSI_Price_Line,0,RSI_Price_Type,i));
MbBuf[i] = (iMAOnArray(RSIBuf,0,Trade_Signal_Line,0,Trade_Signal_Type,i));
}
return(0);
}
----- By the way the real TDI Red Green ex4 (compiled from that mq4 in Post 98,115) does not show: "TDI Red Green (post 25)"
Is this you last post in this thread? You did accept the challenges and lost.
{quote} Maybe I missed something, but the task was to {quote} It is impossible for the lower TDI plots on that M15 chart to have those settings. Those settings can produce only the TDI plot in the subwindow immediately below the stochastic. There are only two ways to get the other two TDI plots on the M15 chart. !. Use a different TDI indicator that uses a different algorithm for the calculations for the plots while using the given values for the settings. 2. Use the same TDI indicator but use settings with values other than those that were listed....
Ignored
Dave it is only to get readers attention diverted from your post where you asked Emmanuel about:
"I am wondering about the status of your MEME buy. Is there an update?"
Am sure if that AUDUSA MEME buy did work he would have posted the result's by now. Looking at AUDUSA chart, buy trades placed on Oct 6, 2019 14:10 at 0.67684 would have been in a drawdown.
Price may or may not move those buy orders into profit today.
{quote} the same default original setting as what Tekkies wrote. use the Traders Dynamic Index with those setting 13,0,2,0,7,0 now we wait for Tekkies to respond.
Ignored
That is impossible to reproduce your chart with the three TDI plots using the same TDI indicator with settings of 13,0,2,0,7,0 on all three plots. That would simply plot the same thing in three different sub windows.
So let me suggest that you use TDI indicator from post #25 so that everyone will be able to use the same one and see for himself what the results are. Clearly, according to the names of the plots in the sub windows, your subwindow plots use some other TDI indicator than the TDI from post #25.
{quote} You got me. Damit Emmanuel now I must keep on posting in this thread. How could you be so mean. ------ It is not the TDI indicator from TMS post#25. It is not possible to draw those lines in Post 98,115 sub window 2,3. using these settings 13,0,2,0,7,0. The MQ4 code inside that TDI indicator won't allow it. RSI_Period = 13; RSI_Price = 0; VolaBand = 34; RSI_Price_Line = 2; RSI_Price_Type = 0; Trade_Signal_Line = 7; Trade_Signal_Type = 0; ----- for(int i=limit;...
Ignored
hey Tekkies
don't jump to conclusion so fast.
first you made the mistake to say I use MTF TDI. I don't. Those are not MTF TDI in sub-windows 3 and 4.
go back and study your own posts... learn from your own mistakes.
your programming skills is also limited like your Keep It Simple belief.
{quote} That is impossible to reproduce your chart with the three TDI plots using the same TDI indicator with settings of 13,0,2,0,7,0 on all three plots. That would simply plot the same thing in three different sub windows. So let me suggest that you use TDI indicator from post #25 so that everyone will be able to use the same one and see for himself what the results are. Clearly, according to the names of the plots in the sub windows, your subwindow plots use some other TDI indicator than the TDI from post #25.
{quote} Dave it is only to get readers attention diverted from your post where you asked Emmanuel about: "I am wondering about the status of your MEME buy. Is there an update?" Am sure if that AUDUSA MEME buy did work he would have posted the result's by now. Looking at AUDUSA chart, buy trades placed on Oct 6, 2019 14:10 at 0.67684 would have been in a drawdown. Price may or may not move those buy orders into profit today.
Ignored
hey Tekkies
learn to be patient and do not jump to conclusion so fast.
I have 2 open positions this week and still have not build up my basket to full 5 positions yet. It is only Oct 08 ... 6 trading days into my 20-trading days cycle. With some profits taken last week, I have some OPM to play on till Oct 25.
do not worry about my trading. I have my cut-loss using 2 weeks look back. Never have floating drawdown more than two weeks.
Honesty is a very expensive gift. You wont find it in cheap people.WBuffett
{quote} hey Tekkies don't jump to conclusion so fast. first you made the mistake to say I use MTF TDI. I don't. Those are not MTF TDI in sub-windows 3 and 4. go back and study your own posts... learn from your own mistakes. your programming skills is also limited like your Keep It Simple belief. Post#67,395 (your second post in this thread) https://www.forexfactory.com/showthr...94#post8834594 and Post#73.461...
Ignored
Won't go into a debate with you Emmanuel. Post the mq4 you used to produce those lines. Reader's can do a code comparison, comply to ex4 use the
settings: 13,0,2,0,7,0 and see for themself.
Will post it again.
If both mq4 files are the same line for line, I won't post in this thread again.
If one line of code is changed, added, omitted you pack your bags and never post again in this thread Trading Made Simple.
Will allow only one change:
IndicatorShortName("TDI Red Green"); to IndicatorShortName("TDI Red green (post 25);
or a single (one) line with the code you used to display "(post 25)"
did you notice the price gap? beware of price gap and study how the TDI response to the gap - previous bar Close and current bar Close. {image}
Ignored