This is an excellent thread.
For those getting hung up on SentiFX's indicator, please do not derail the thread. The information that he is using to build his bubbles is freely available for anyone willing to put in a bit of effort. I have a much more clunky version (see below) but you can simply keep an eye on one of the sites that post the info like Myfxbook or Oanda to get it for yourself.
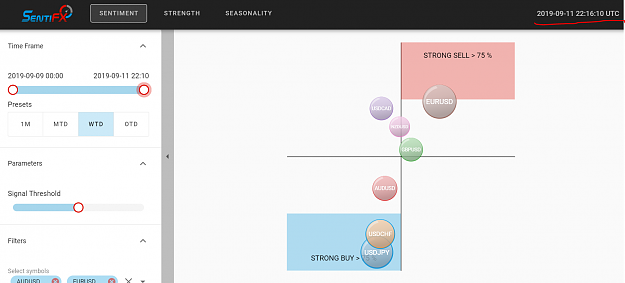
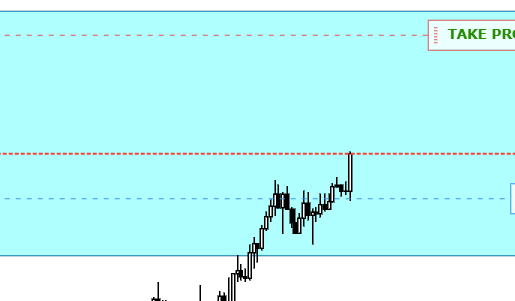
The important message here is that if you concentrate on pairs that have extreme retail sentiment (say over 80%) and those pairs have decent volume, you are greatly increasing the probability of making successful trades using your favourite trade entry identification methods if they are against the crowd. SentiFx is using obvious stop hunting areas for his entries which is also my personal preference. But this is a strategy that has been around a long, long time and is not unique to George or FractalFreak so please relax and just try to learn what you can from this valuable thread.
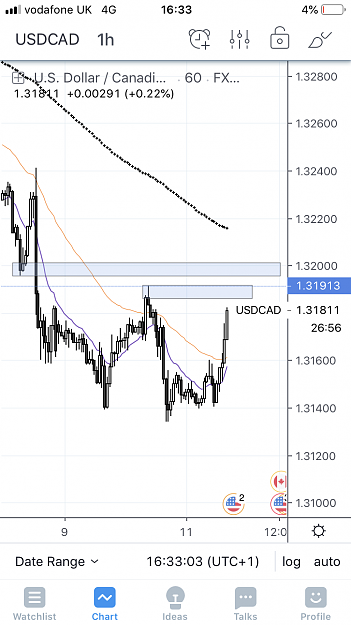
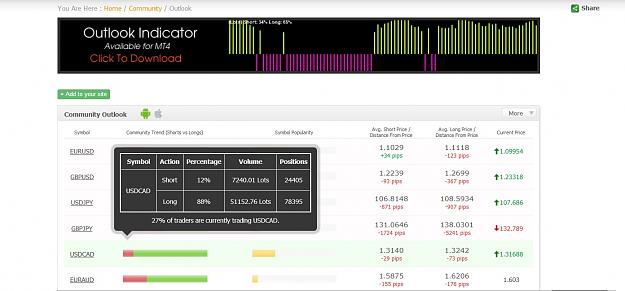
I attach part of the Myfxbook sentiment page (accessible to all) that shows retail sentiment on USDCAD was 88% long today (hence SentiFX's bubble to look for shorts).
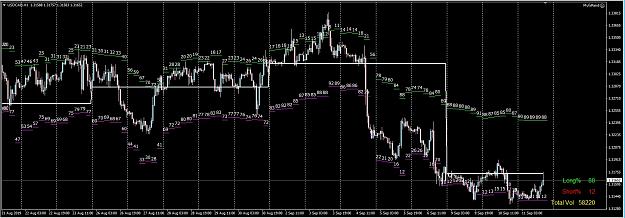
I have been collecting the sentiment data from Myfxbook for a little over a year as it gives another piece of information that I also find valuable. On my rather messy chart, you can see the historic percentages on the chart, with a green line under the long percentages and a magenta line under the short percentages. Those lines are at the average retail long and short prices - are we surprised that price is almost always between the two? i.e. Neither retail long or short is in profit!
Unfortunately I can't share my very clunky indicator as I could only obtain the data from Myfxbook using my personal login. But we are all free to look at the data there anytime we wish.
Many thanks SentiFX for this valuable thread.
For those getting hung up on SentiFX's indicator, please do not derail the thread. The information that he is using to build his bubbles is freely available for anyone willing to put in a bit of effort. I have a much more clunky version (see below) but you can simply keep an eye on one of the sites that post the info like Myfxbook or Oanda to get it for yourself.
The important message here is that if you concentrate on pairs that have extreme retail sentiment (say over 80%) and those pairs have decent volume, you are greatly increasing the probability of making successful trades using your favourite trade entry identification methods if they are against the crowd. SentiFx is using obvious stop hunting areas for his entries which is also my personal preference. But this is a strategy that has been around a long, long time and is not unique to George or FractalFreak so please relax and just try to learn what you can from this valuable thread.
I attach part of the Myfxbook sentiment page (accessible to all) that shows retail sentiment on USDCAD was 88% long today (hence SentiFX's bubble to look for shorts).
I have been collecting the sentiment data from Myfxbook for a little over a year as it gives another piece of information that I also find valuable. On my rather messy chart, you can see the historic percentages on the chart, with a green line under the long percentages and a magenta line under the short percentages. Those lines are at the average retail long and short prices - are we surprised that price is almost always between the two? i.e. Neither retail long or short is in profit!
Unfortunately I can't share my very clunky indicator as I could only obtain the data from Myfxbook using my personal login. But we are all free to look at the data there anytime we wish.
Many thanks SentiFX for this valuable thread.
Attached Image(s) (click to enlarge)
6