Patiently loading it.... & I will ride up and down to the targets.
...don’t try this except you know what you are doing.
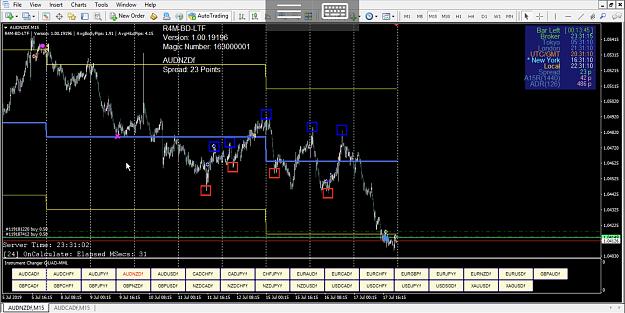
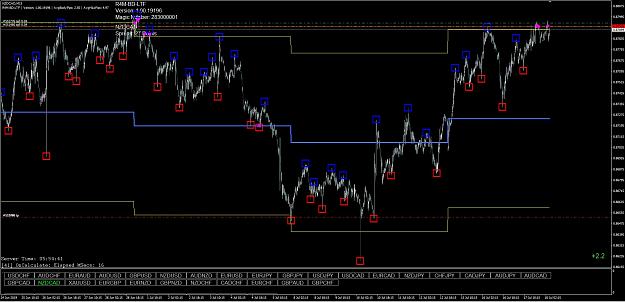
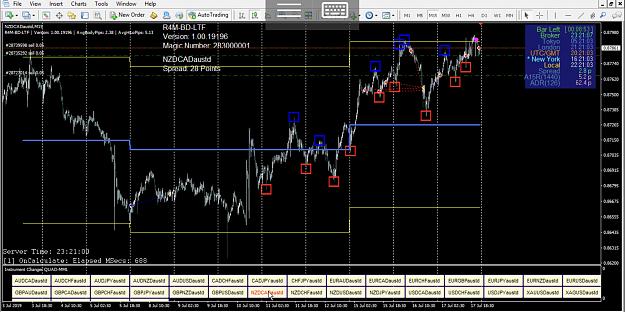
Attached Image (click to enlarge)
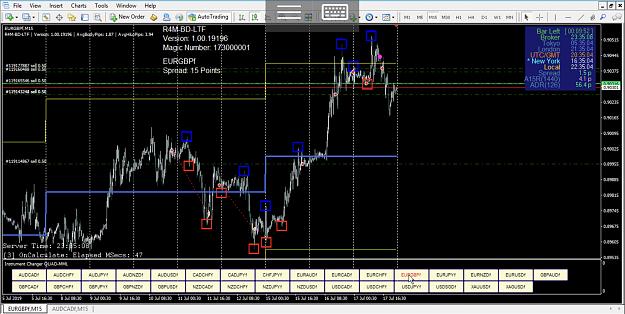
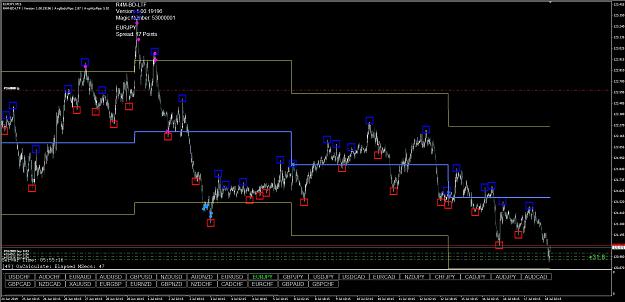
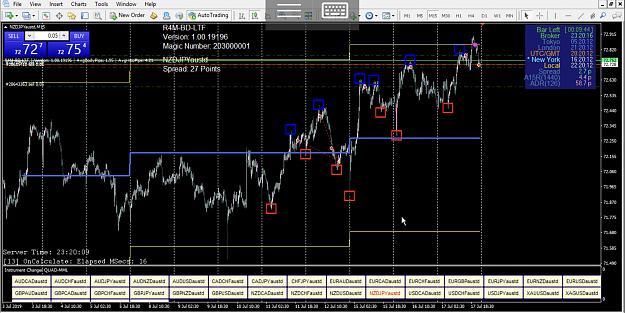
Attached Image (click to enlarge)
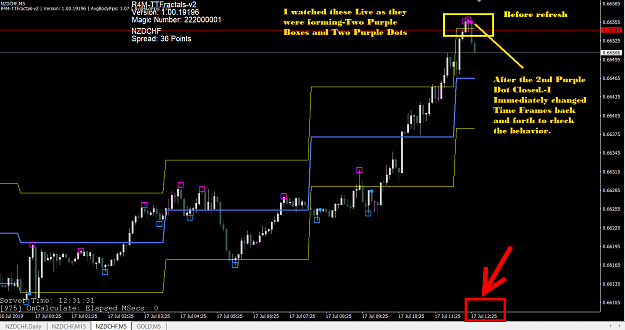
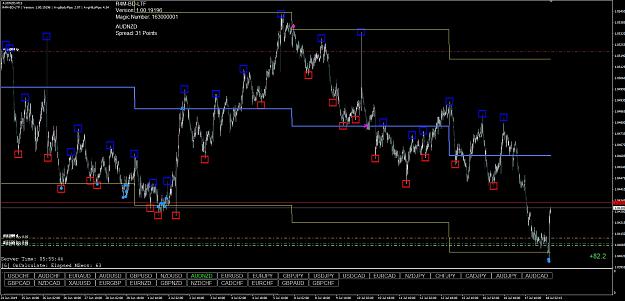
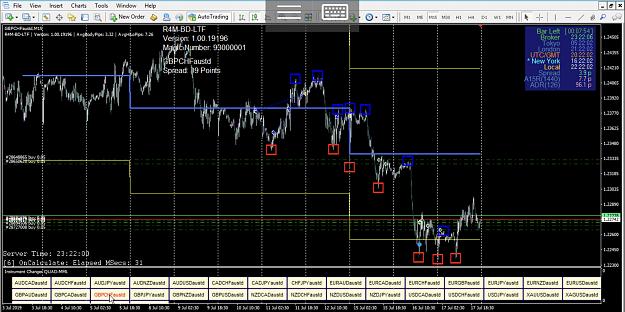
Attached Image (click to enlarge)
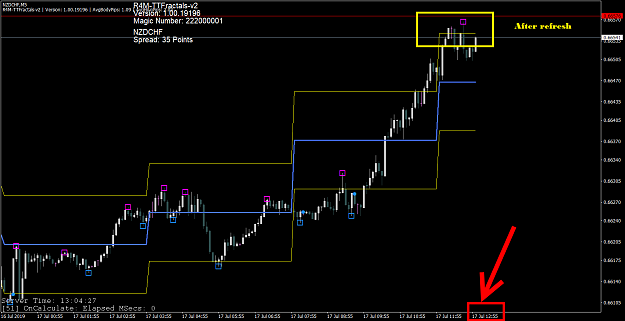
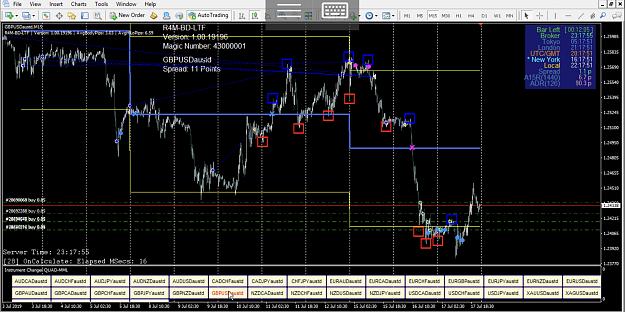
Attached Image (click to enlarge)
...don’t try this except you know what you are doing.
1