Disliked{quote} Can you describe method 2 more please how you do this ? Thank You Best regardsIgnored
Continuation Trades:
A Continuation Trade is when there has already been a trade in that direction, but you were stopped out OR got out for some other reason and then you get another signal to enter in the same direction.
You can go long again if a bar turns back to Dodger Blue/Blue after being Red/Maroon or Red/Blue AND the Dodger Blue/Blue bar's close is above the Yellow Line and all other indicators agree.
You can go short again if a bar turns back to Red/Maroon after being Dodger Blue/Blue or Red/Blue AND the Dodger Red/Maroon bar's close is below the Yellow Line and all other indicators agree.
Variation(s):
If all indicators imply long, and the Stochastics 8,3,3 (the thin SlateGray Line) retreats below the Purple 50 Line, then it crosses back above the Purple 50 Line and all indicators still imply long, you can enter long.
If all indicators imply short, and the Stochastics 8,3,3 (the thin SlateGray Line) retreats above the Purple 50 Line, then it crosses back below the Purple 50 Line and all indicators still imply short, you can enter short.
Attached Image (click to enlarge)
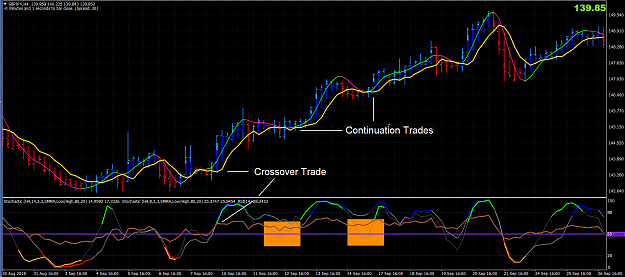
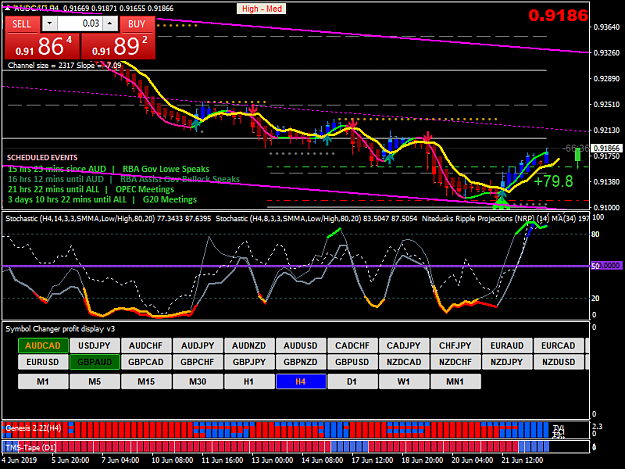
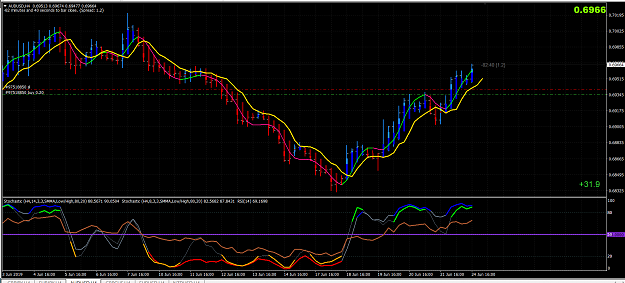
1. Reference the 2 orange boxes on the chart in the lower window.
a) Directly above them in the upper window, notice that just before both orange boxes, we were in an uptrend (meaning: HMA line was green and is above the Yellow Line, candles were blue/blue, price is above the Yellow Line, both Stochastics and the RSI are above the Purple 50 Line).
b) Then the green HMA line turned pink and some of the candles changed from blue/blue (meaning UP) to red/red (meaning DOWN) and the price closed below the Yellow Line.
2. In the lower window look at the orange boxes. Notice that Stochastics 14,3,3 (the thicker SlateGray Line) and the RSI stay above the Purple 50 Line BUT the Stochastics 8,3,3 (the thinner SlateGray Line) has dipped below the Purple 50 Line.
3. Wait for the candles turn blue/blue again AND the HMA Line turns green again (and is above the Yellow Line again), AND price is above the Yellow Line again. Then when the Stochastics 8,3,3 (the thinner SlateGray Line) crosses back above the Purple 50 Line that is how and exactly when you enter a Continuation Trade.
* The exact time you enter is bolded.
-----------------------------------------------------------------
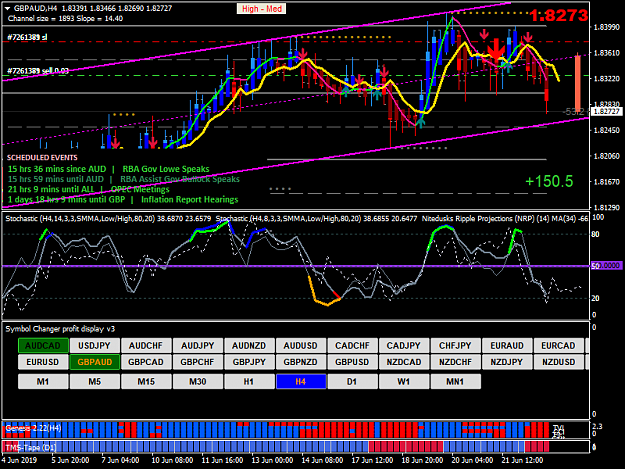
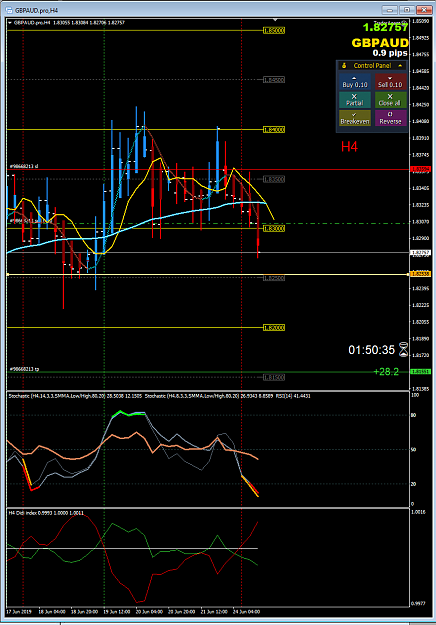
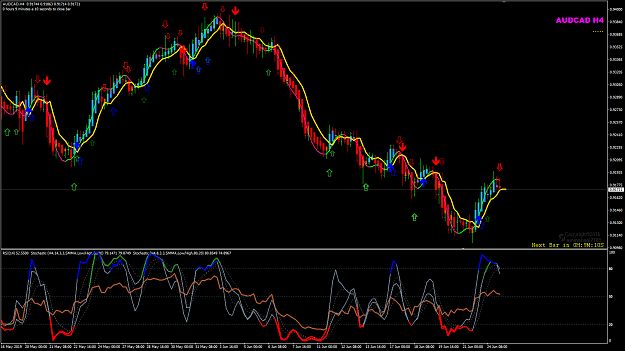
Here's a Short Continuation Trade...With a Slight Variation
Attached Image (click to enlarge)
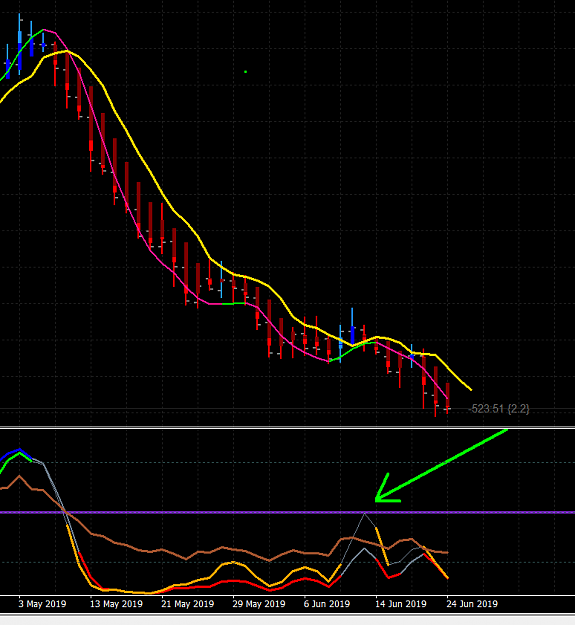
All the same rules apply as outlined above, BUT notice how the Stochastics 8,3,3 doesn't actually cross the Purple 50 Line, it just gets very close. And that's good enough too. Usually, the more shallow a pullback is (which is what the Stochastics 8,3,3 is signaling in this case), it's a sign that the trend is strong and wants to continue.
Always a Student, Never a Master - Emulate What Works
2