Hi,
Another look at what markets I'll be looking over during the coming days/weeks..
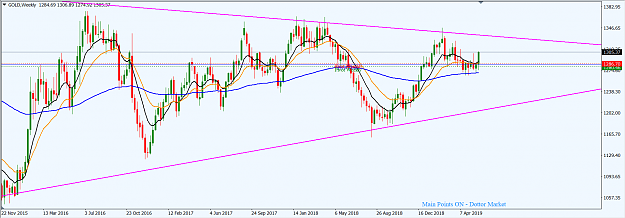
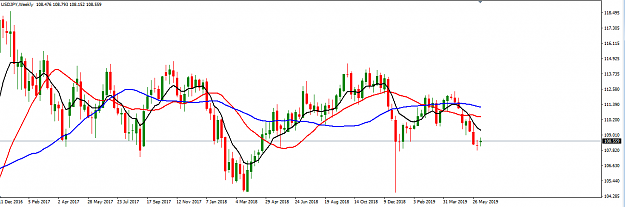
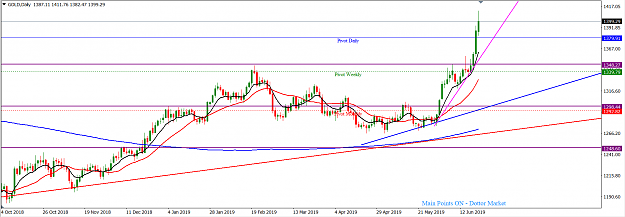
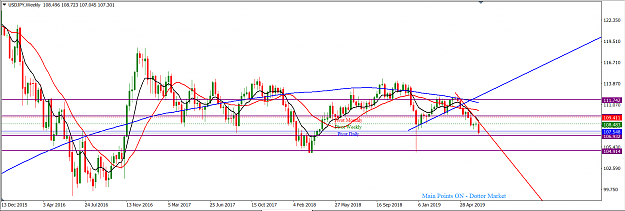
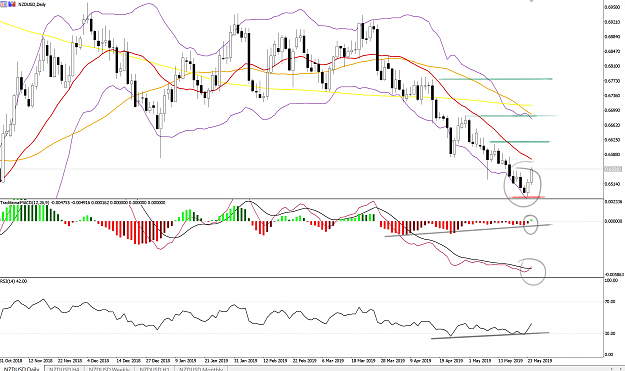
NZDUSD - Bullish
W: Hammer at end of down trend
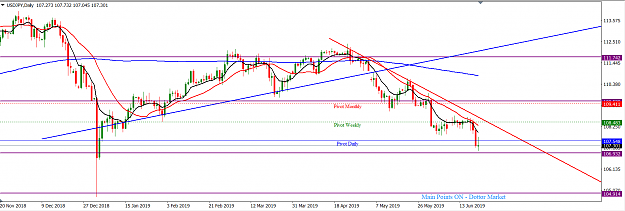
D: Bullish engulfing pattern followed by bull candle
D: MACD positive histogram divergence
D: MACD bullish line crossover
D: RSI positive divergence
D: Reversal at bottom of Bollinger Band
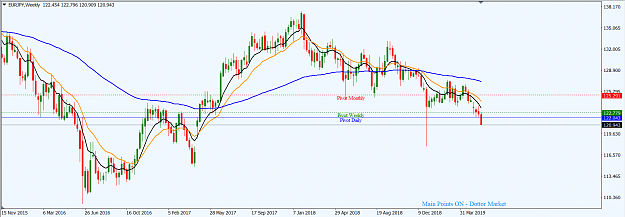
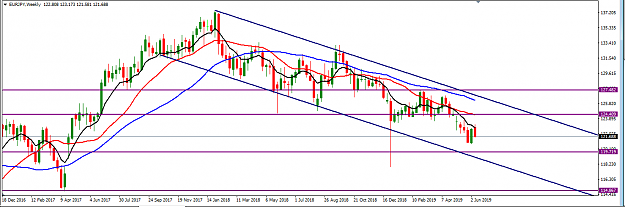
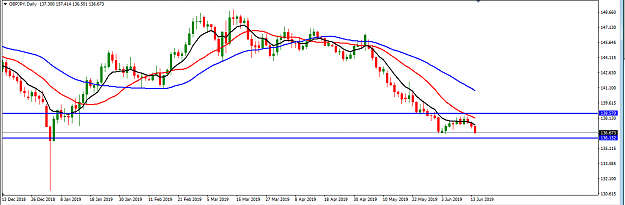
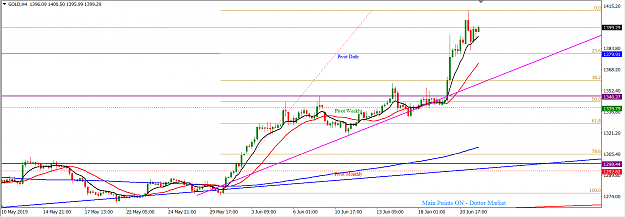
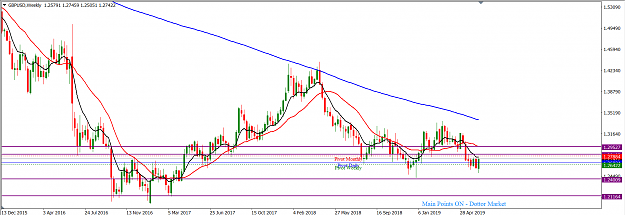
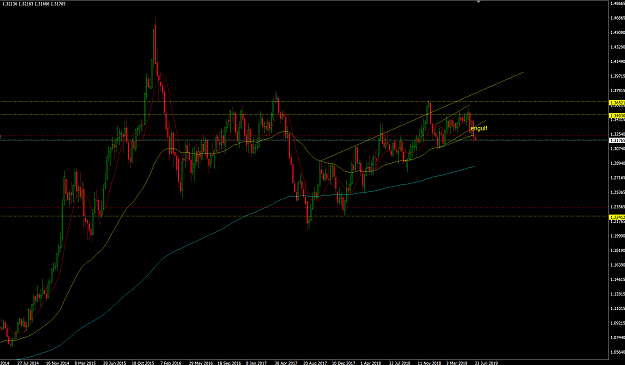
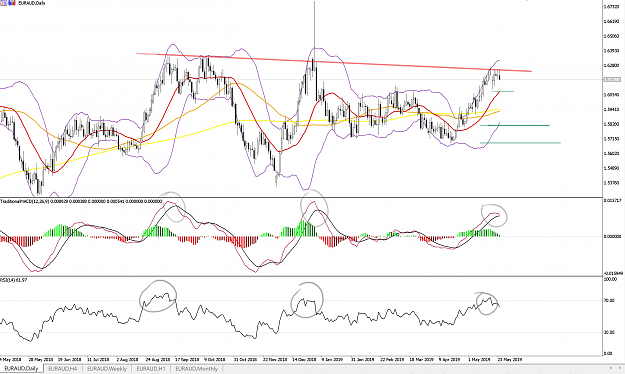
EURAUD - Bearish
W: Doji inside prior week candle
W: Price at top of Bollinger
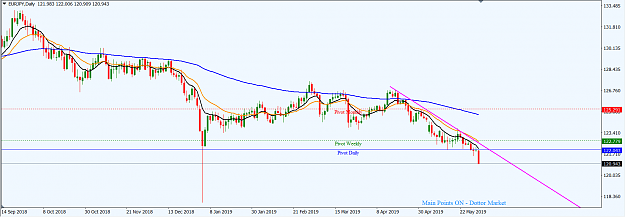
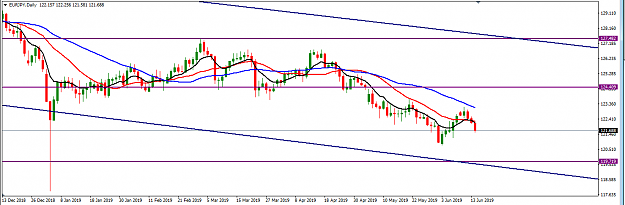
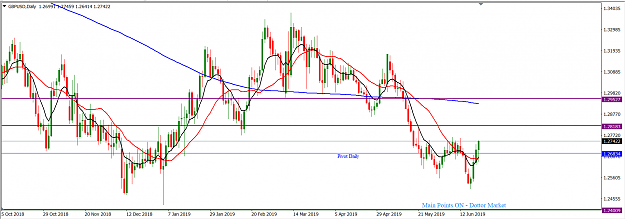
D: Price reacting to descending trend line
D: look for repeat reversal at MACD crossovers, as shown at previous highs
D: Look for repeat reversal at RSI oversold areas as shown at previous highs
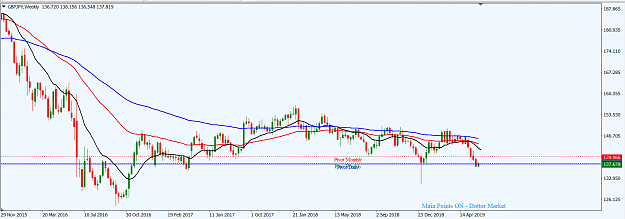
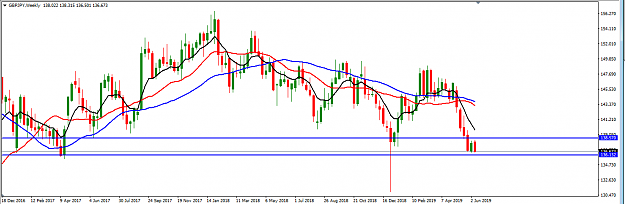
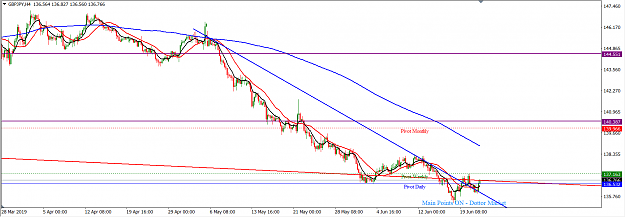
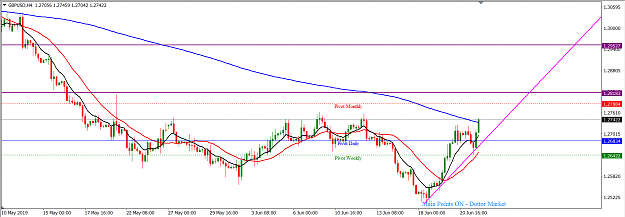
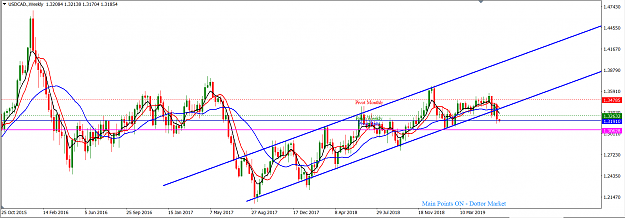
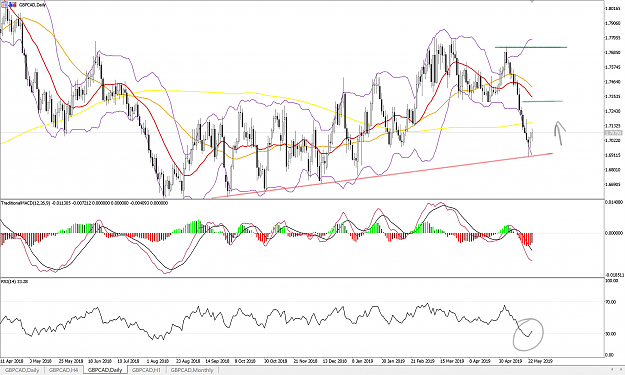
GBPCAD - Bullish
W: Hammer at bottom of Bollinger Band after down trend
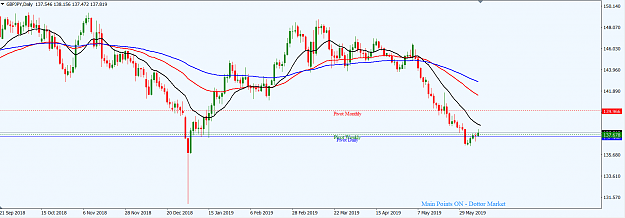
D: Price reacting to ascending trend line as support
D: Hammer at support
D: RSI at oversold area
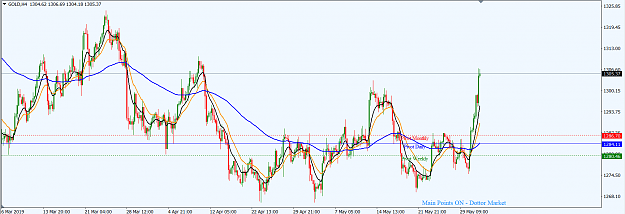
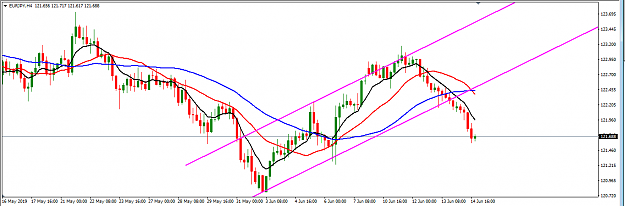
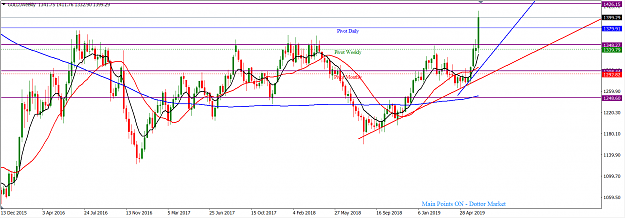
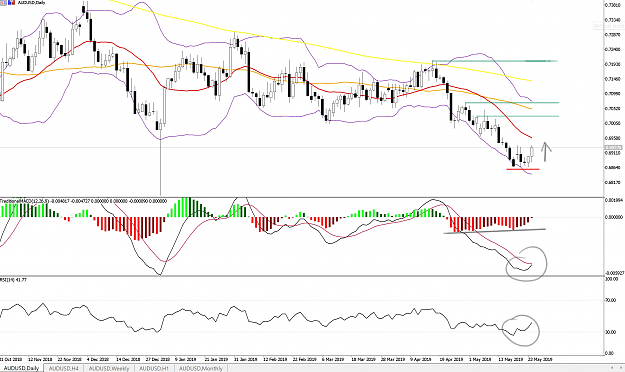
AUDUSD - Bullish
D: Price rejecting lower level at bottom of Bollinger Band
D: RSI indicating price in oversold condition
D: MACD positive histogram divergence
D: MACD bullish line crossover
H4: Positive divergence over last week
Another look at what markets I'll be looking over during the coming days/weeks..
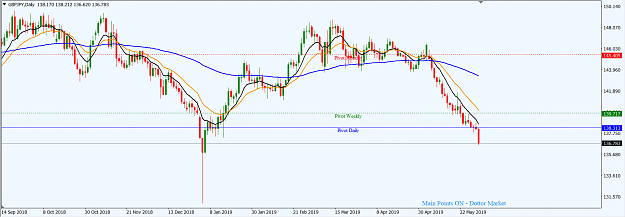
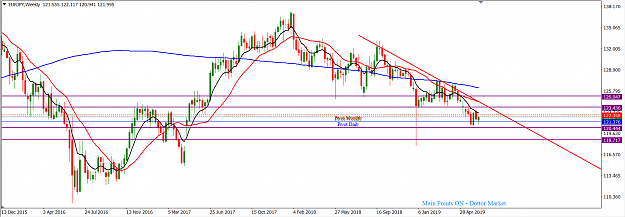
NZDUSD - Bullish
W: Hammer at end of down trend
D: Bullish engulfing pattern followed by bull candle
D: MACD positive histogram divergence
D: MACD bullish line crossover
D: RSI positive divergence
D: Reversal at bottom of Bollinger Band
Attached Image (click to enlarge)
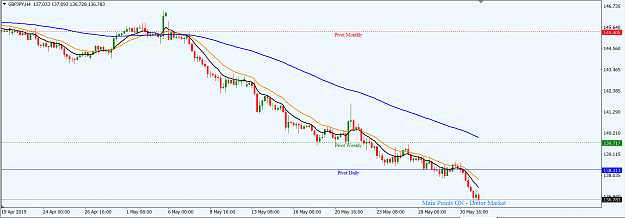
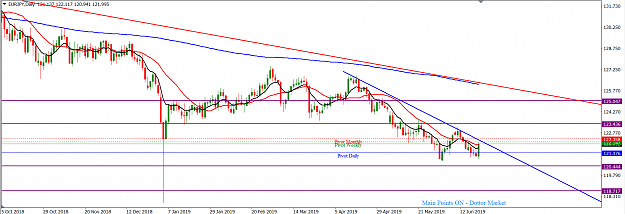
EURAUD - Bearish
W: Doji inside prior week candle
W: Price at top of Bollinger
D: Price reacting to descending trend line
D: look for repeat reversal at MACD crossovers, as shown at previous highs
D: Look for repeat reversal at RSI oversold areas as shown at previous highs
Attached Image (click to enlarge)
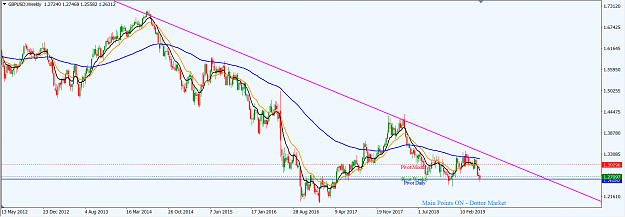
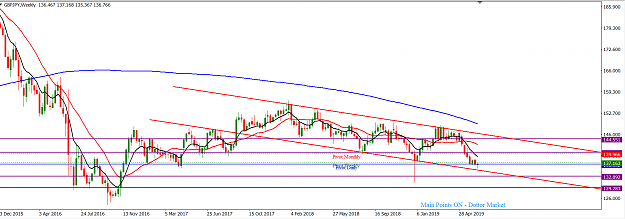
GBPCAD - Bullish
W: Hammer at bottom of Bollinger Band after down trend
D: Price reacting to ascending trend line as support
D: Hammer at support
D: RSI at oversold area
Attached Image (click to enlarge)
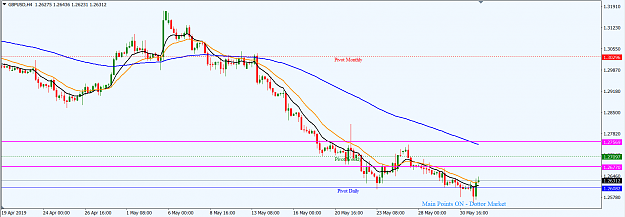
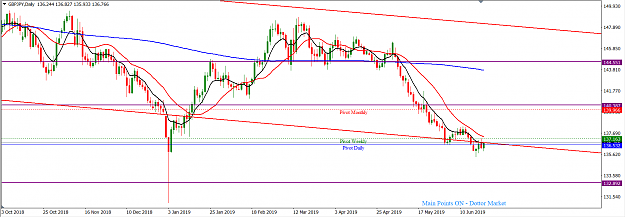
AUDUSD - Bullish
D: Price rejecting lower level at bottom of Bollinger Band
D: RSI indicating price in oversold condition
D: MACD positive histogram divergence
D: MACD bullish line crossover
H4: Positive divergence over last week
Attached Image (click to enlarge)
2