Hi all,
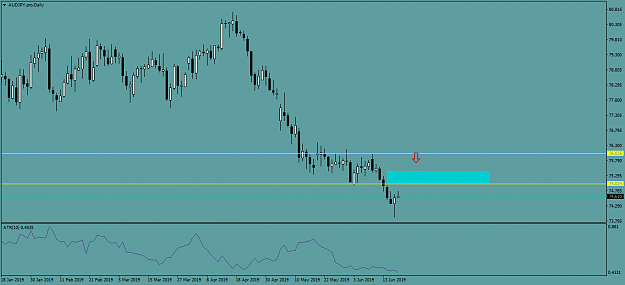
Seems to be a bit of news due this week that could affect the markets especially AUD and EUR so I'll be cautious. Here's the potential positions I'll be stalking this week.
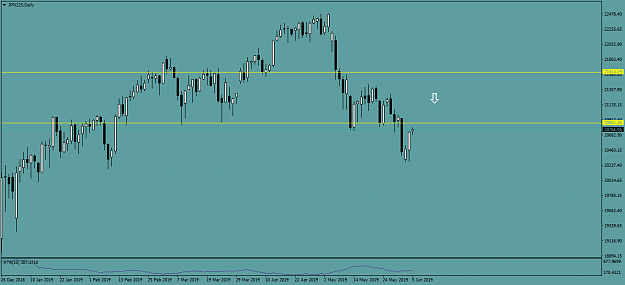
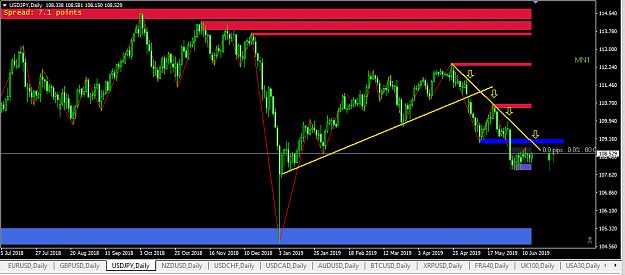
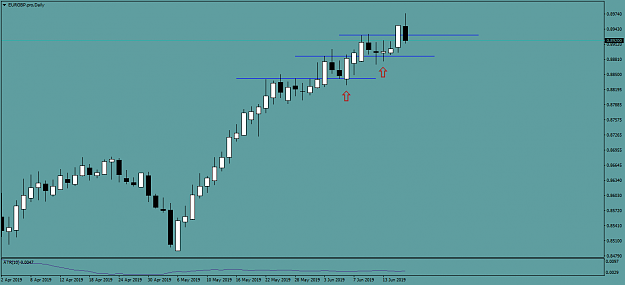
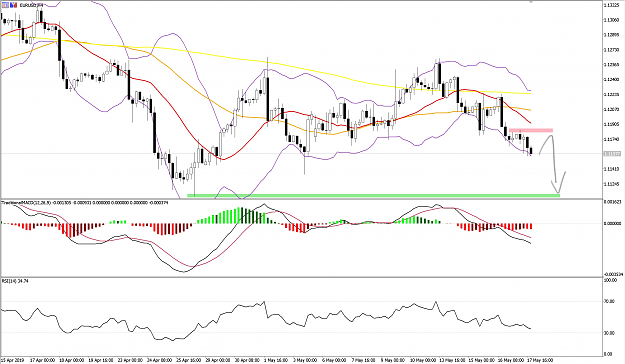
EURUSD - Bearish
Continuation from previous week - Moving averages in down trending order (20 < 50 < 200)
H4: Looking to short at pullback into the downtrend
D: MACD Cross under signal line
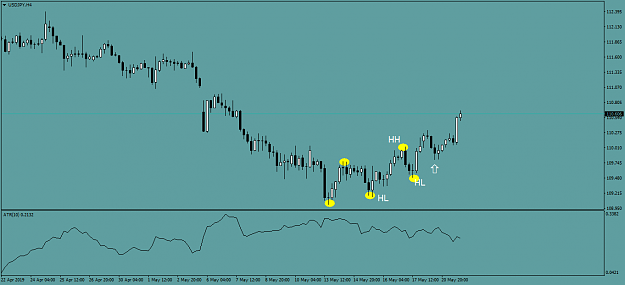
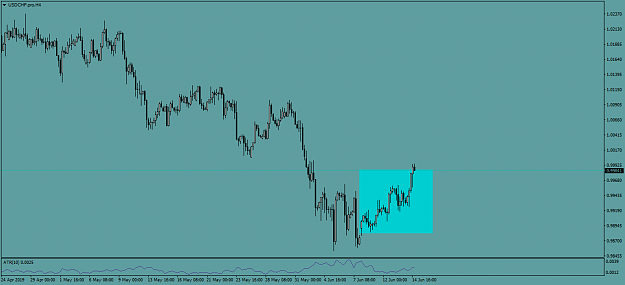
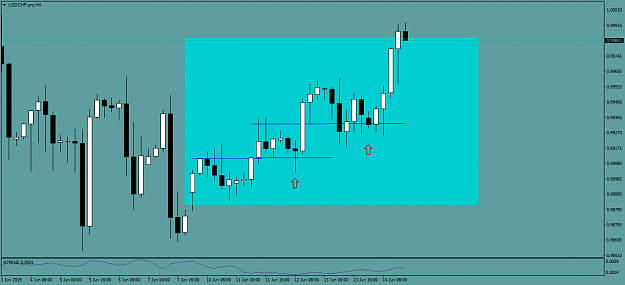
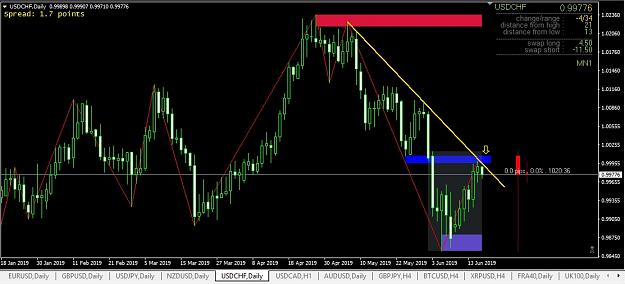
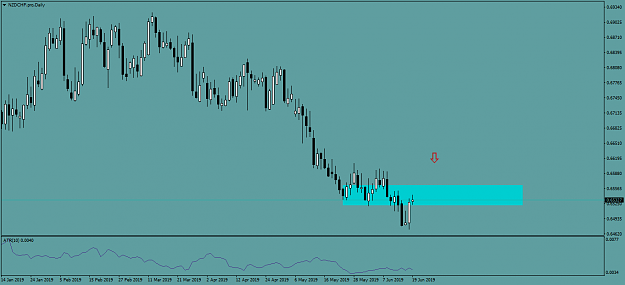
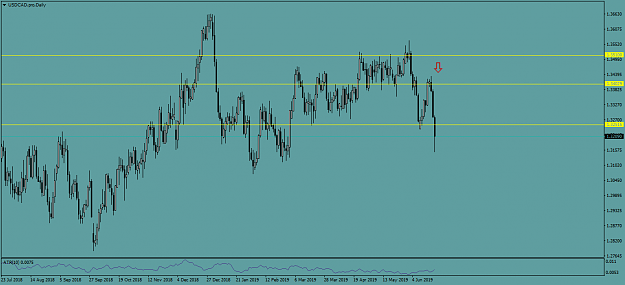
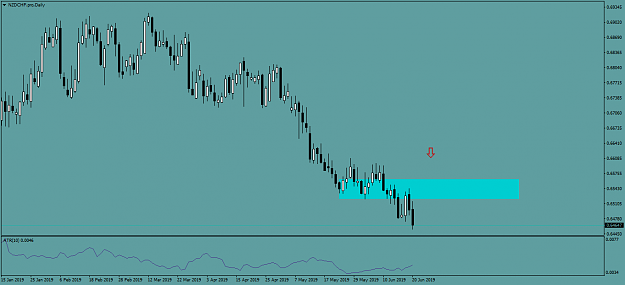
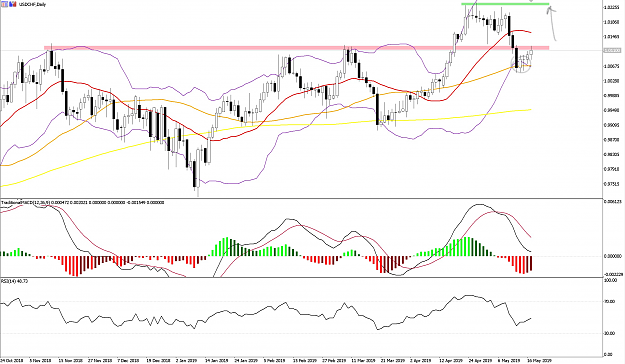
USDCHF - Bullish
W: Price above Moving Averages in up trending order (20 > 50 > 200)
W: Price closed with a hammer last week signifying rejection at the 20MA area
D: Price reacted to 50MA, with piercing line pattern, set stop just below
D: Price at bottom Bollinger Band
D: Price is at resistance, so await to see if there is a break above
H4: Price reacting to 20MA to the upside, however 50/200MAs above so as above, await to see if there is a break
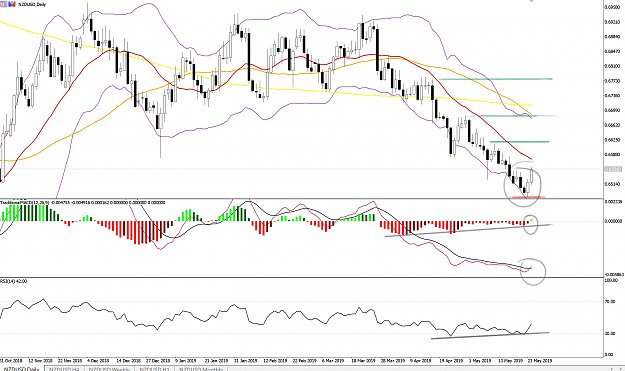
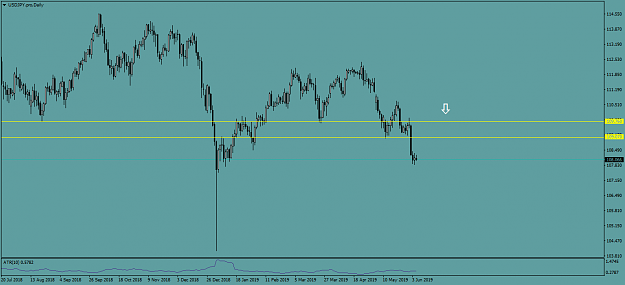
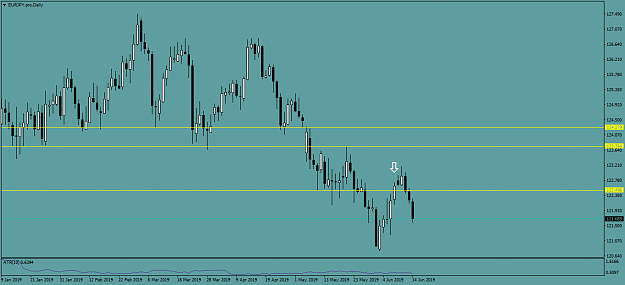
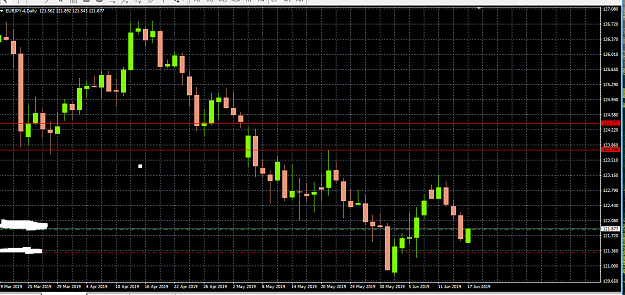
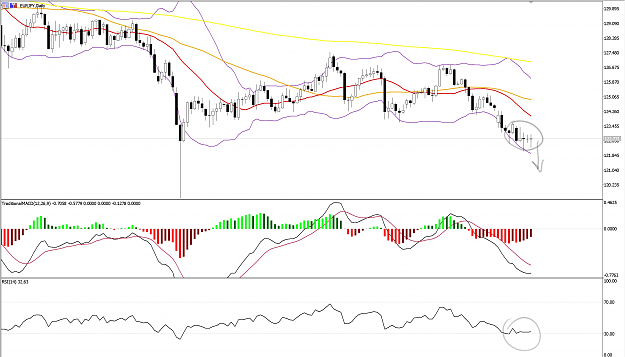
EURJPY - Bearish
Moving averages in down trending order (20 < 50 < 200) Looking to short at pullback into the downtrend
W: Price closed below downward gap, as well as last week's doji
W: Price closed below 50% fib level from 2016 pivot low
D: Price undecided for last few days (3xdoji) This could point to relieve of selling pressure before moving further to the downside
D: RSI not signalling oversold conditions
D: No crossover indicated on MACD
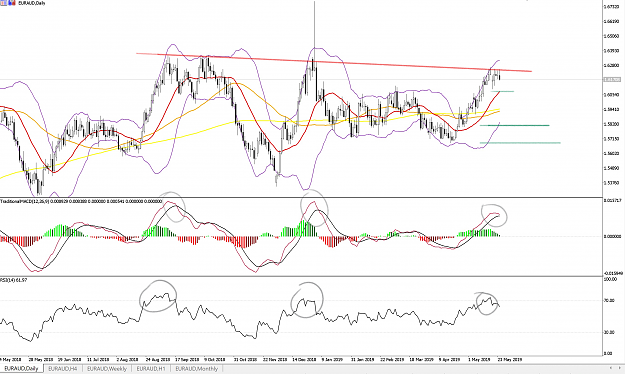
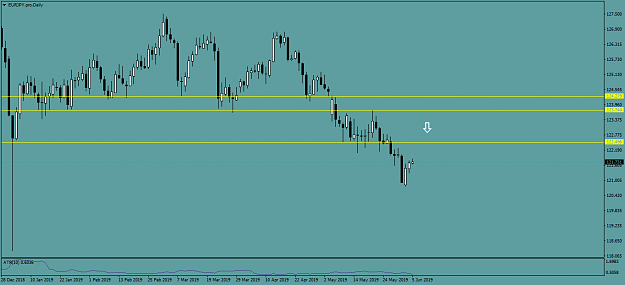
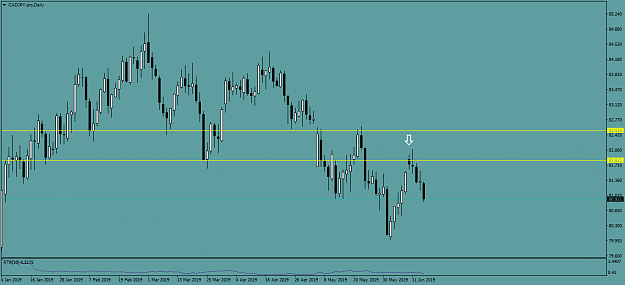
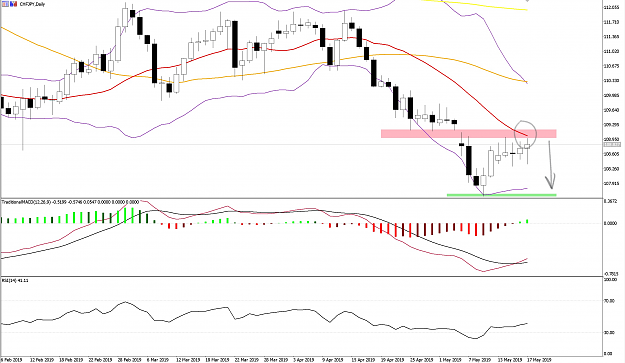
CHFJPY - Bearish
Moving averages in down trending order (20 < 50 < 200) Looking to short at pullback into the downtrend
W: Price unable to break above hammer made two weeks ago at strong potential resistance area,
W: Indicators not showing convincing reversal signals
D: Price at 20MA acting as potential resistance
D: Price at gap down acting as resistance
D: Price seems to be weakening as rose to resistance area
H4: Price at top of Bollinger Band and resistance area, previous bar showing long upper shadow
Seems to be a bit of news due this week that could affect the markets especially AUD and EUR so I'll be cautious. Here's the potential positions I'll be stalking this week.
EURUSD - Bearish
Continuation from previous week - Moving averages in down trending order (20 < 50 < 200)
H4: Looking to short at pullback into the downtrend
D: MACD Cross under signal line
Attached Image (click to enlarge)
USDCHF - Bullish
W: Price above Moving Averages in up trending order (20 > 50 > 200)
W: Price closed with a hammer last week signifying rejection at the 20MA area
D: Price reacted to 50MA, with piercing line pattern, set stop just below
D: Price at bottom Bollinger Band
D: Price is at resistance, so await to see if there is a break above
H4: Price reacting to 20MA to the upside, however 50/200MAs above so as above, await to see if there is a break
Attached Image (click to enlarge)
EURJPY - Bearish
Moving averages in down trending order (20 < 50 < 200) Looking to short at pullback into the downtrend
W: Price closed below downward gap, as well as last week's doji
W: Price closed below 50% fib level from 2016 pivot low
D: Price undecided for last few days (3xdoji) This could point to relieve of selling pressure before moving further to the downside
D: RSI not signalling oversold conditions
D: No crossover indicated on MACD
Attached Image (click to enlarge)
CHFJPY - Bearish
Moving averages in down trending order (20 < 50 < 200) Looking to short at pullback into the downtrend
W: Price unable to break above hammer made two weeks ago at strong potential resistance area,
W: Indicators not showing convincing reversal signals
D: Price at 20MA acting as potential resistance
D: Price at gap down acting as resistance
D: Price seems to be weakening as rose to resistance area
H4: Price at top of Bollinger Band and resistance area, previous bar showing long upper shadow
Attached Image (click to enlarge)