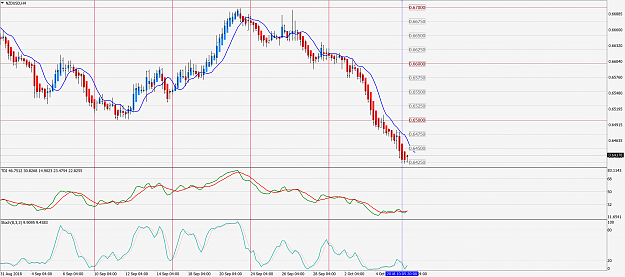
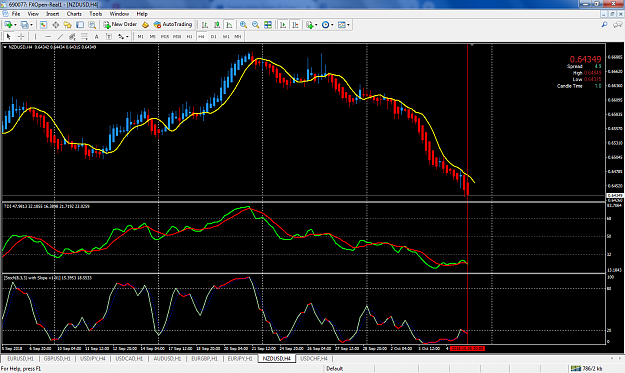
What about this TDI H4 setup for shorting NZD/USD. Would this be valid by the rules?
What i see:
- TDI crossed ✓
- TDI green angle 4-6 ✓
- Stock confirms ✓
- Average candles are red/bearish ✓
- First candle (Enter on candle 1-2) ✓
- Higher TF (Daily, Weekly) bearish ✓
So far so good? What i am not sure about is:
First, the TDI green/red is below 32 level on H4. So it would be better to wait for a buy signal? Do we actually look for this on the H4 or is overbought/oversold more relevant to the next higher TF, meaning looking at the Daily for this instead? Thats still confusing me. Or do we only look for trade opportunities where the TDI signal is somewhere in the middel between 68/32 so 50?
Second, what about Support and Resistance. When i look to the left on either H4, Daily or the Weekly Chart i can´t see any zone here where i could draw a horizontal line here. (Just looking back for a couple of weeks) So if it says "trade away from Support or Resistance" we are somewhere to nowhere here. In conclusion does this mean we want to wait until some swing highs are formed here and and first think about going short if price is near to this resistance again? Vice versa only thinking about going long if price formed some swing lows we could draw a horizontal line that marks support and then wait for a buy signal to trade away from this support to the upside.
thanks for your kind help in advance.
Attached Image (click to enlarge)
What i see:
- TDI crossed ✓
- TDI green angle 4-6 ✓
- Stock confirms ✓
- Average candles are red/bearish ✓
- First candle (Enter on candle 1-2) ✓
- Higher TF (Daily, Weekly) bearish ✓
So far so good? What i am not sure about is:
First, the TDI green/red is below 32 level on H4. So it would be better to wait for a buy signal? Do we actually look for this on the H4 or is overbought/oversold more relevant to the next higher TF, meaning looking at the Daily for this instead? Thats still confusing me. Or do we only look for trade opportunities where the TDI signal is somewhere in the middel between 68/32 so 50?
Second, what about Support and Resistance. When i look to the left on either H4, Daily or the Weekly Chart i can´t see any zone here where i could draw a horizontal line here. (Just looking back for a couple of weeks) So if it says "trade away from Support or Resistance" we are somewhere to nowhere here. In conclusion does this mean we want to wait until some swing highs are formed here and and first think about going short if price is near to this resistance again? Vice versa only thinking about going long if price formed some swing lows we could draw a horizontal line that marks support and then wait for a buy signal to trade away from this support to the upside.
thanks for your kind help in advance.