{quote} Raedmaa please review the attachment showing an expansion beside a retracement. As you can see you did not plot the 200% level on the retracement tool but lept directly to 2.618 which created the error cheers Nut. {image}
Ignored
It's not the tool or using it the wrong way. We really have different data. Our measured swing is larger, that's the problem.
Many thanks Nut, I appreciate your work!
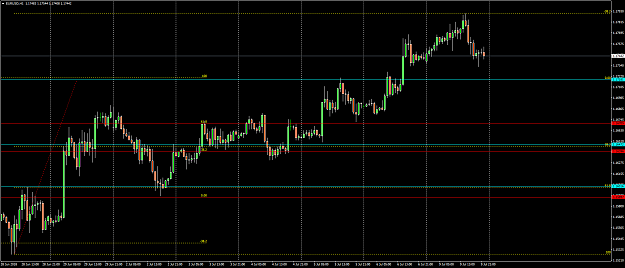
{quote} It's not the tool or using it the wrong way. We really have different data. Our measured swing is larger, that's the problem. Many thanks Nut, I appreciate your work! {image}
Ignored
Yes ... i think nut have to give us more than this .. this is just fib tool explained nothing else.
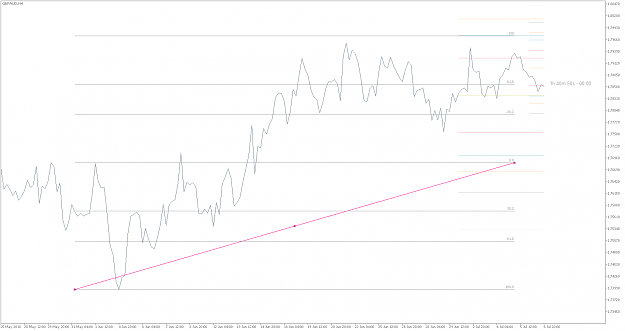
{quote} I agree I have shown you an easy method but I cannot and will not define your trading style. Without wishing to sound abrupt you can define your own style logically using the Fib expansion or spend good money on a crap book and let somebody else define you. I shall attach a chart that may spark some ideas that fit with the basic model. Between the -100 and zero line can you spot any opportunities to enter positions in line with the model. {image}
Ignored
I've only been trading since 2006 (joined FF in 2009) - a novice compared to you but in that time I have managed to create a trading style - without buying any crap books too. I look at FF (amongst other sites) quite often whilst waiting for trading opportunities to occur - using my trading styles of course. I rarely comment on the vast array of other people's trading ideas that crop up here on FF - but it is fun reading them, helps to pass the time and great entertainment at times.
As I said, I thought your contribution was an interesting one at first - but it is only a variation of the use of fib tool. It is just as hit and miss as other any other use of it really.
I think a man with your vast knowledge could give your followers a little more than just a variation of the use of fibs.
Good luck to you in your retirement and I wish your followers every success.
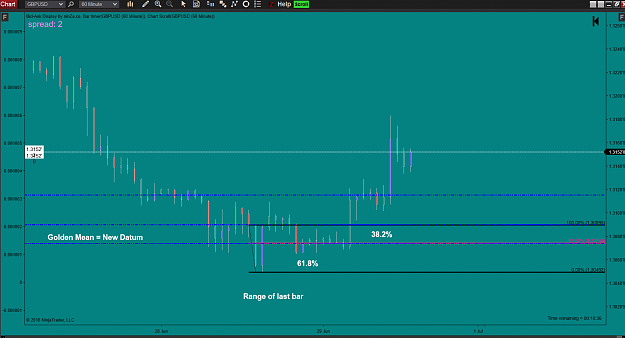
{quote} Hi Nut, Do you measure from swing low to previous swing high? I still think its not clear how you are choosing your initial points. In some posts you use swing in others you just use the range of last candle like in the picture?? Are you able to provide some clarity please {image}
Ignored
Both methods will work but measuring the last swing low to swing high is quicker. remember every length has a golden mean at 61.8% followed by a 38.2% which equals 61.8 + 31.8 = 1 but the ratio of the two distances will be, 61.8/38.2 =1.618 : 1. It's this ratio you are trying to maintain.
{quote} I've only been trading since 2006 (joined FF in 2009) - a novice compared to you but in that time I have managed to create a trading style - without buying any crap books too. I look at FF (amongst other sites) quite often whilst waiting for trading opportunities to occur - using my trading styles of course. I rarely comment on the vast array of other people's trading ideas that crop up here on FF - but it is fun reading them, helps to pass the time and great entertainment at times. As I said, I thought your contribution was an interesting...
Ignored
Yes, it's only a variation and as you know there are many. I like this method because it consistently uses the basic concept of the golden mean in line with Fibonacci's original work. Trust me when I say if I knew the holy grail I would tell you. If I were a Guru then I would write a book and charge silly amounts of money. As for the subject of Fibs I have no more to give. Your acknowledgment of my knowledge and experience is greatly appreciated thank you. I wish each and every one of you success with your trading
{quote} I agree I have shown you an easy method but I cannot and will not define your trading style. Without wishing to sound abrupt you can define your own style logically using the Fib expansion or spend good money on a crap book and let somebody else define you. I shall attach a chart that may spark some ideas that fit with the basic model. Between the -100 and zero line can you spot any opportunities to enter positions in line with the model. {image}
Ignored
Let me give a try, when price bounced off the -61.8 line a few times indicating support, we can enter a long.
But I am not sure which Fib level we shld target, I guess the minimum would be the 38.2 line.
{quote} Let me give a try, when price bounced off the -61.8 line a few times indicating support, we can enter a long. But I am not sure which Fib level we shld target, I guess the minimum would be the 38.2 line.
Ignored
Basically yes but we are looking to maintain a ratio of 1.618. -61.8 is the same as positive 38.2 up from -100. ( -100) - 61.8 = +38,2 so a minimum target should be in this case the 0.00 level as we still have 61.8% to add to 38.2 to establish a bullish relationship of 1,618. Once again 61.8/38.2.
So now after the golden mean in the last chart it is reasonable to expect a further 38.2 expansion from the golden mean. The expansion can be seen in this chart. Price has become trapped at this level as the sheep stealers and horse rustlers battle it out. This 38.2% level is the defining point between the uptrend or downtrend. Have I cleared things up or baffled everybody. No offence intended but it may take a little time for the concept take hold. {image}
Ignored
Hi Nut, if we are thinking that price is reversing at the 38.2 line in the image, we should target the -61.8 line?
Thanks.
|
Joined Aug 2008
|
Status: Member
|165 Posts|
Online Now
Hi Nut,
Big THANK YOU! There is value in this thread!
In management there is a saying:"You can only please some of the people some of the time".
So connect your sensibility only to these ones. The others don't count so much for you!
Go England!
Hi Nut, Big THANK YOU! There is value in this thread!
Ignored
I completely agree. This way of using Fibonacci was not know to me and it has added in my trading strategy a very simple tool to get reliable targets. I am truly thankful to Nut for sharing this method. So Nut, please continue your guidance as your contribution is highly appreciated by many.
{quote} It's not the tool or using it the wrong way. We really have different data. Our measured swing is larger, that's the problem. Many thanks Nut, I appreciate your work! {image}
Ignored
Yes, and even like this, the trading decision would be the same.
That's what I like at this tool: different starting points ( last extreme bar or last extreme move ) go into ( almost ) the same levels. Different data go into ( almost ) the same trading decision.
And of course it's leading, not lagging. And it's simple.
Smart!
Nut
Well done for sharing your work. Fibs work because so many people use them (as I am sure you appreciate). You use fibs in an interesting way and I will not comment on if that is better or worse than any others. It is not the tool that is being used that makes a master craftsman but the years of experience the craftsman has built up on the journey (combined with his innate capabilities). Early on you talk about your success being down to using targets - this is interesting and would I suspect be very useful to hear more about. A traders psychological approach is probably one of the most important differentiators between success and failure. It sounds to me like you have a plan you have developed and operate with the conviction and mindset to carry it out to success - something most of us get wrong. Would loove to hear your thoughts. regards R.
Katte, kabuto no o wo shime yo. Size doesn't matter, leverage is the killer
Joined Aug 2009
|
Status: Just trade it!
|1,230 Posts
hi Nut,
what do you mean with 'keeping the measurement horizontal'?
measuring the lenght of swing is vertical for me, i don't get it
measuring the lenght of a swing or a candle (last one including shadows) seems doesn't matter?
Money is made by sitting, not trading. Jesse L. Livermore
hi Nut, what do you mean with 'keeping the measurement horizontal'? measuring the lenght of swing is vertical for me, i don't get it measuring the lenght of a swing or a candle (last one including shadows) seems doesn't matter?
Ignored
This does not apply to the MT4 fibonacci tools, it only applies to the charting package that Nut uses.