Hi guys
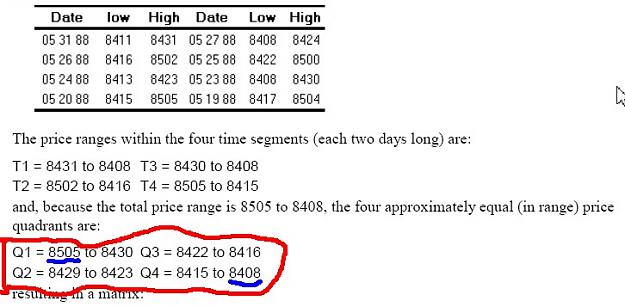
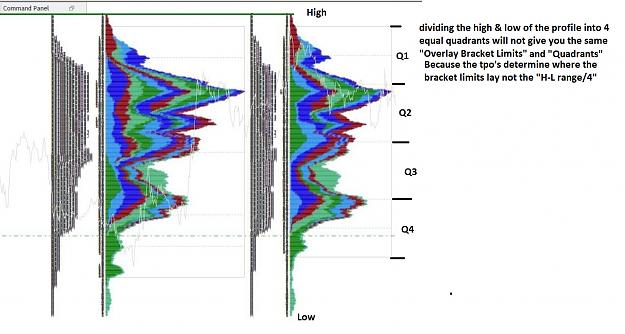
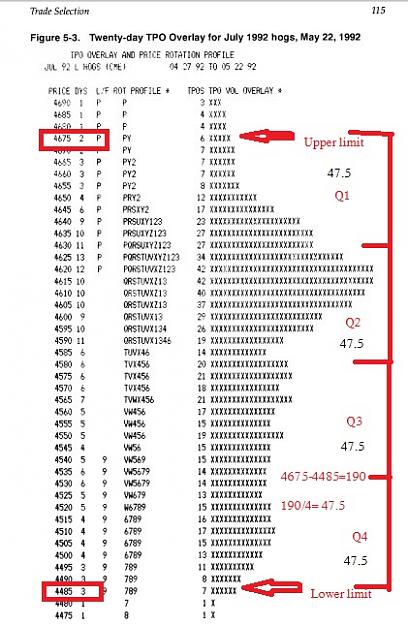
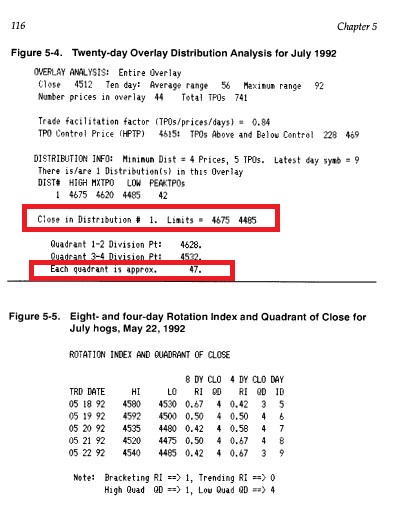
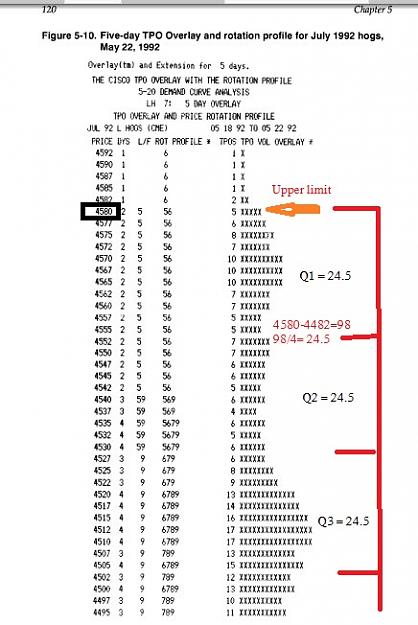
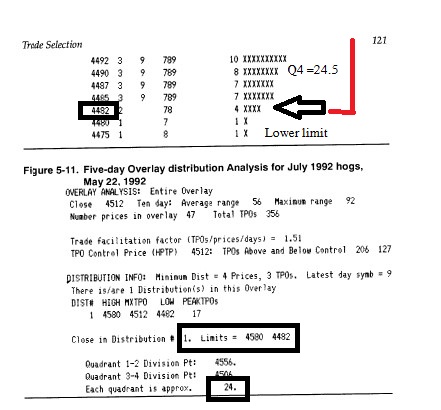
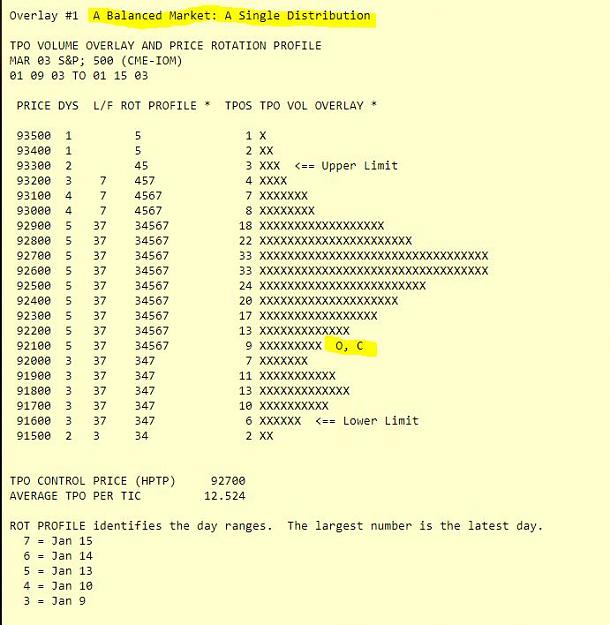
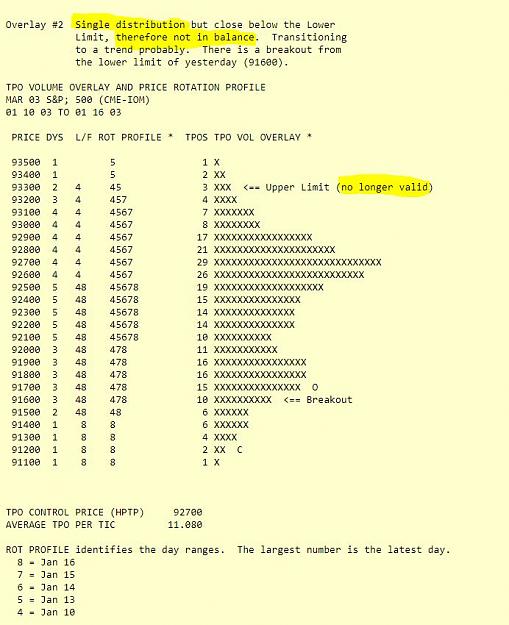
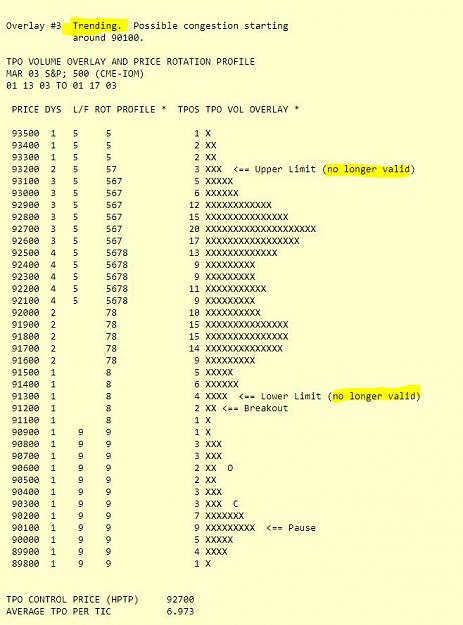
Will you agree with me when i say that the total high and low range are not divided into 4 equal quadrants?
Will you agree with me when i say that the total high and low range are not divided into 4 equal quadrants?
Attached Image (click to enlarge)