CBOE Volatility Indexes on US Equity Benchmarks (VIX, VXN, VXO, VXD, VIX3mo., RVX) and Put Call Ratio: signs of buy opportunity???
![]() ► By ... 0000-0001-5086-7401 & goo.gl/N8xLvv ◀
► By ... 0000-0001-5086-7401 & goo.gl/N8xLvv ◀![]()
☒ Aim of the post.
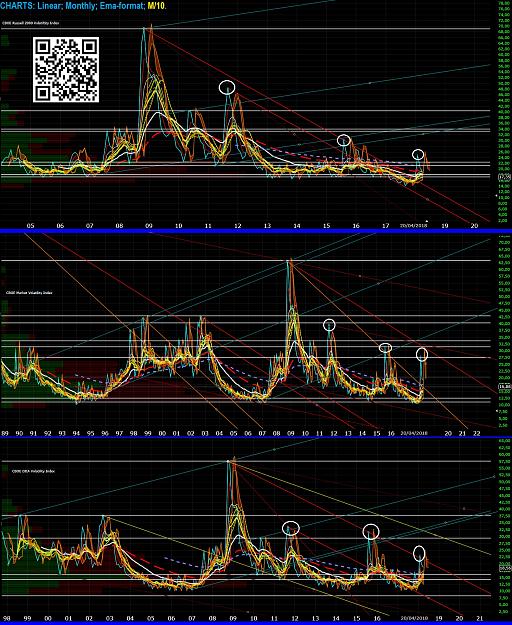
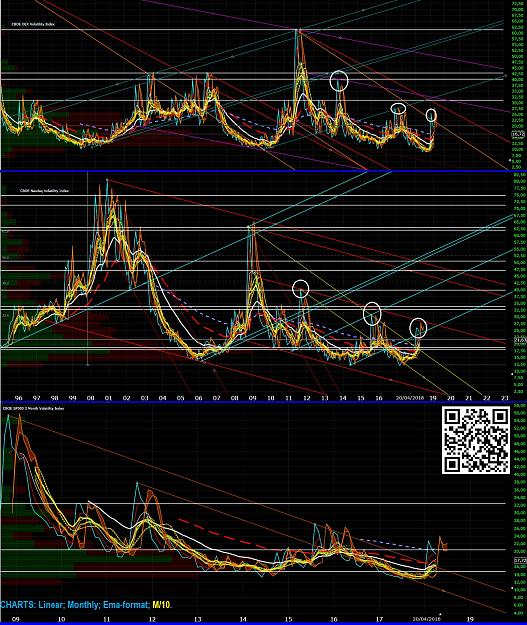
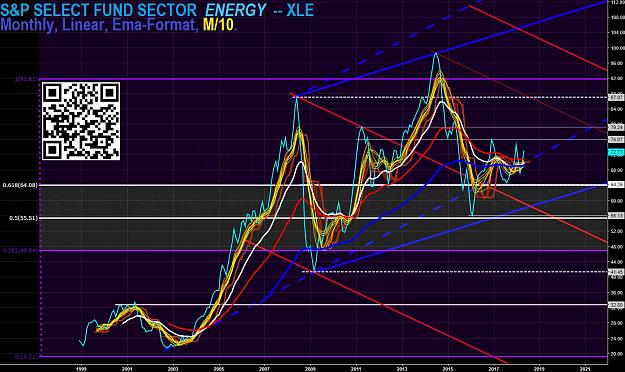
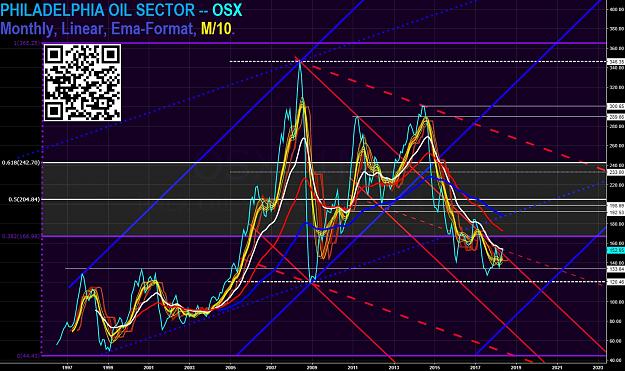
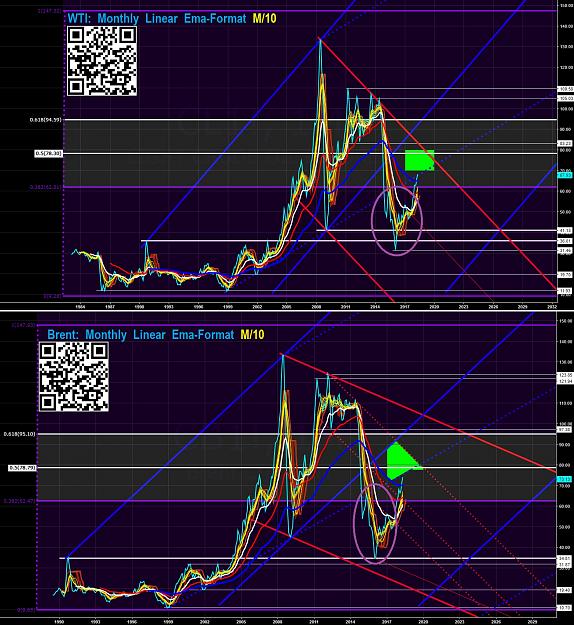
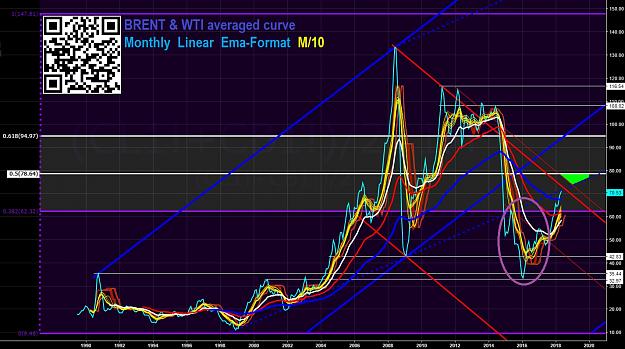
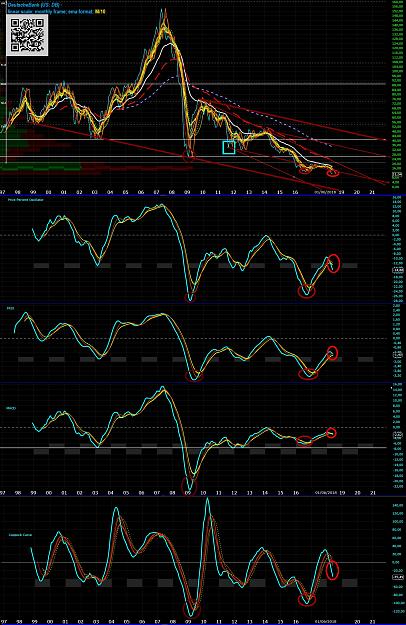
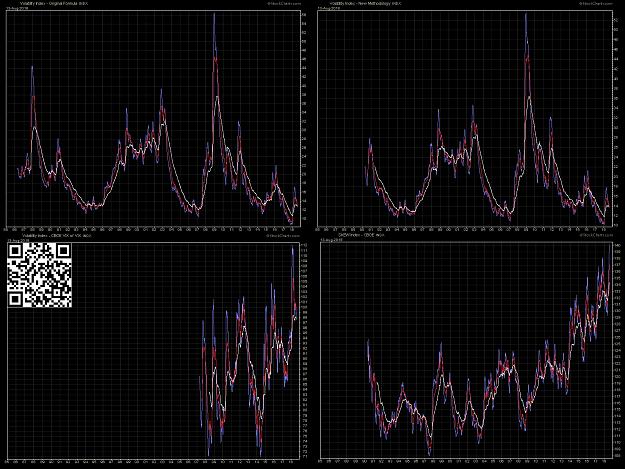
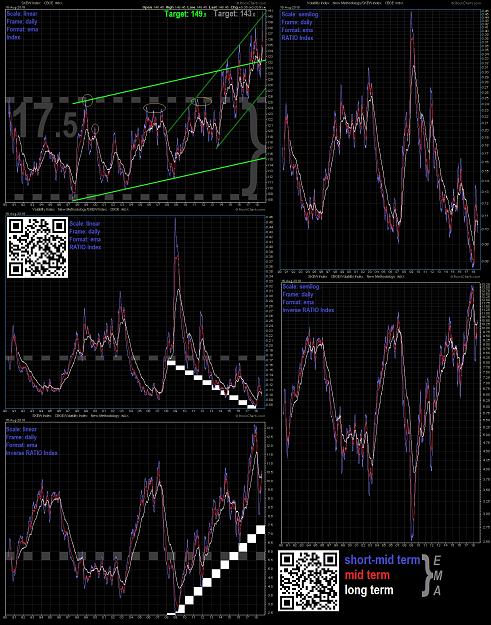
In this post there is a short up-date of the main CBOE volatility indexes based on US equity benchmarks, as S&P100 (VXO), S&P500 (VIX; VIX3m), Dow Jones (VXD), Nasdaq100 (VXN), Russell2k (RVX).
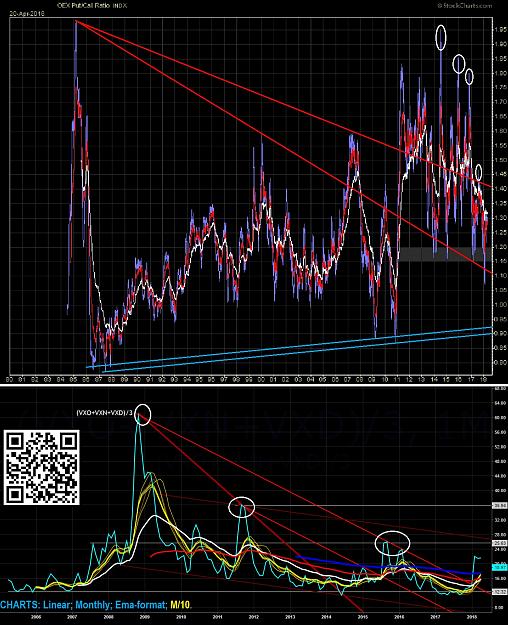
Graphical data obtained are used also with the average mash-up of VXO, VXN, VXD and also with the CBOE Put Call Ratio on S&P100.
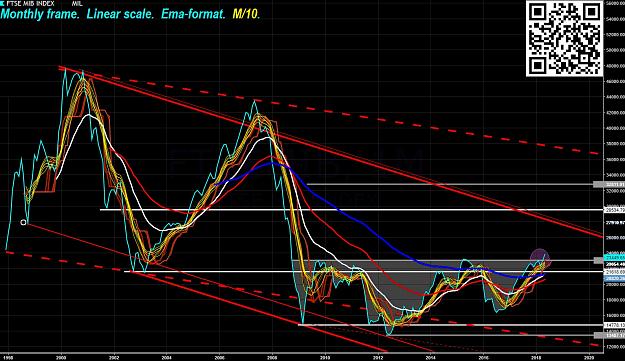
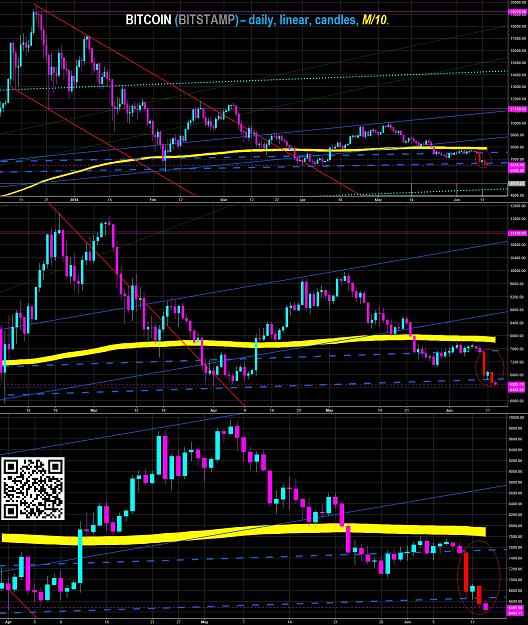
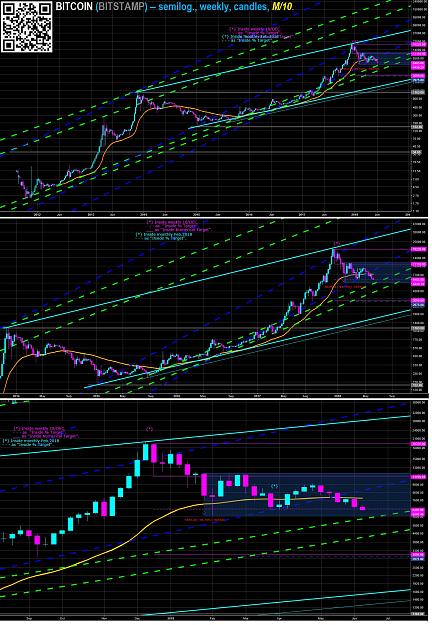
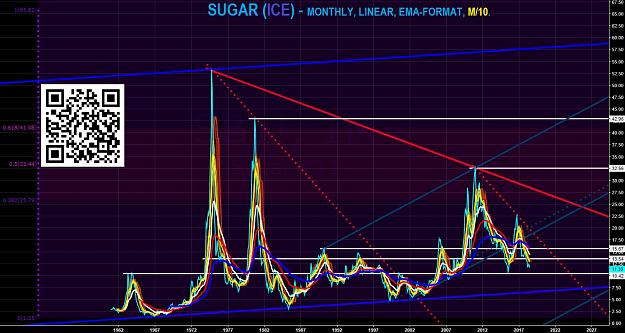
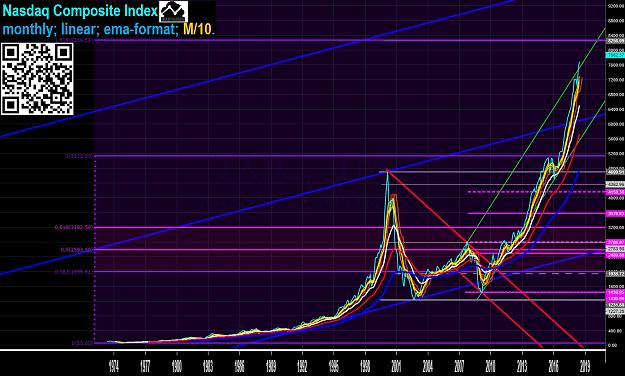
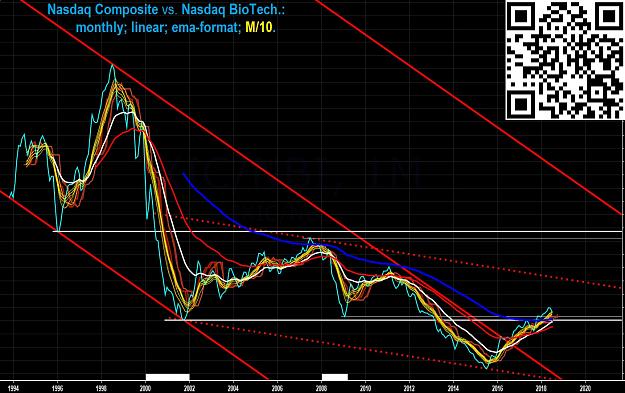
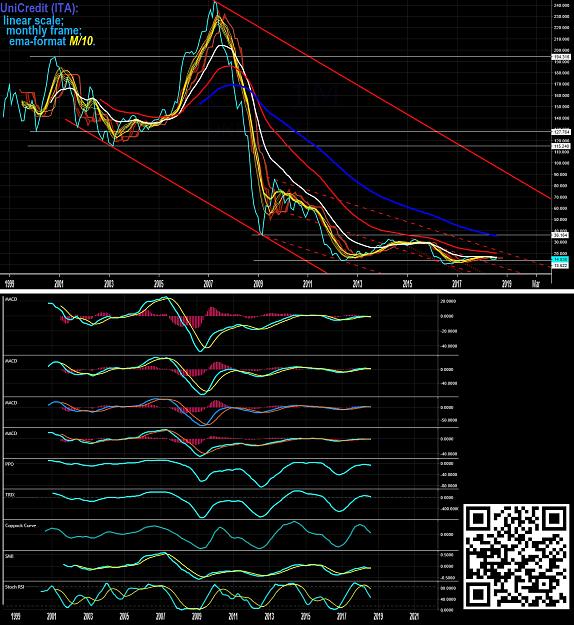
M/10 or Multiple 10mo. average, is a combination of the following yellow-orange lines: sma, ema, fwma,vwma,AL-ma, triangular-ma, Wilders-ma, Envelope-ema, Ichimoku Transformed}.
☒ Graphical Elements & Data.
The key tops from 2008/2009 are in descending array.
The historical low is centered in 2017 for all volatility curves (except VXD), also for the averaged US curve.
Put Call Ratio shows a continuation-bear according to main volatility indexes.
Until now there are not signals of long-term reversal of the main trend.
The descending array of tops is an interesting buy signs on equity benchmarks, but only if volatility prices go below M/10.
☒ Chart sources.
❖ FreeStockCharts - StockCharts - TradingView.
☒ Sorry for my bad English. I hope that this post is at least minimally useful { Contact }.
Tuned on main trend, but follows short-medium term signs from underlying prices, for a correct & real-time set-up.
It is very important do not anticipate the main trend of the underlying financial instruments.
☻/♪ ❖ EARTH.pk, Alert 2.O !!! ❖
/▌
/|
I.M.O. by Sa!Vi ►►♡
#Ke'SaddhaPha'Pe'Kampa': #BundaBunda EMPIRE
Attached Image(s) (click to enlarge)