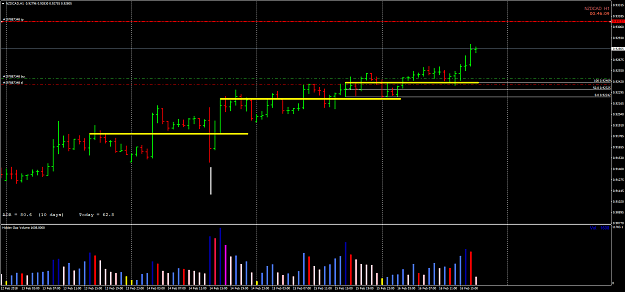
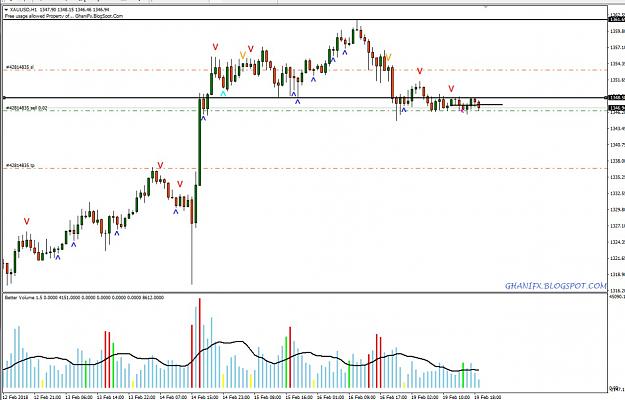
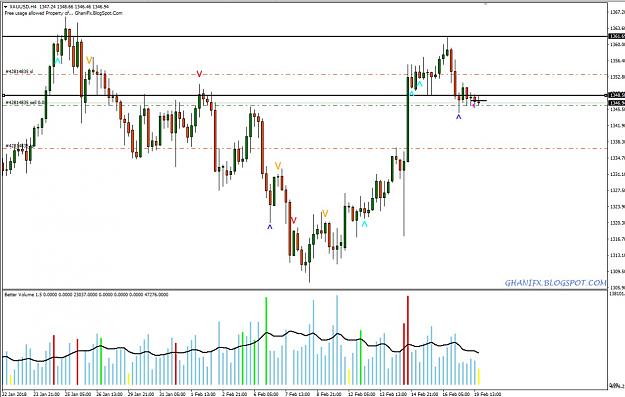
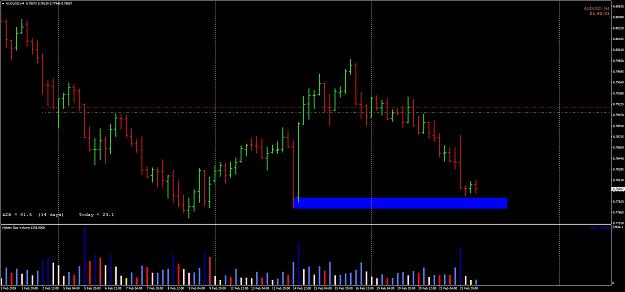
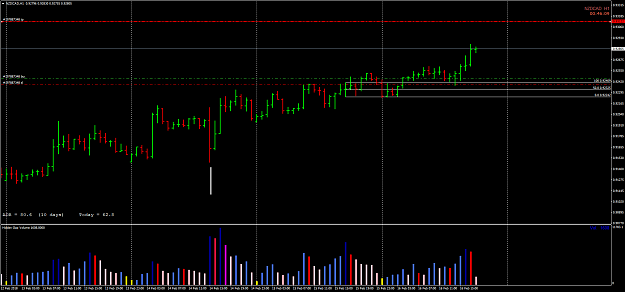
Big buying on H1 chart from Feb 14th. had to wait a day to see price move up.
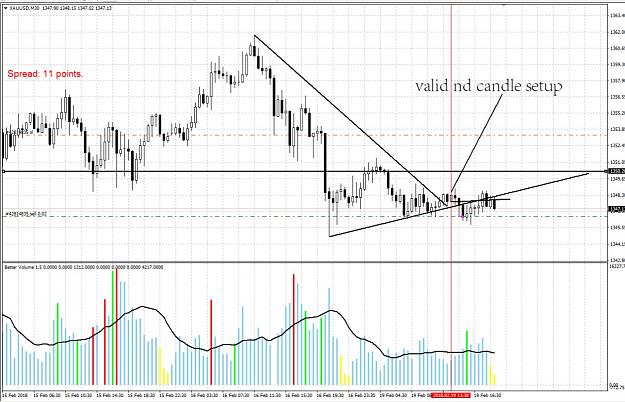
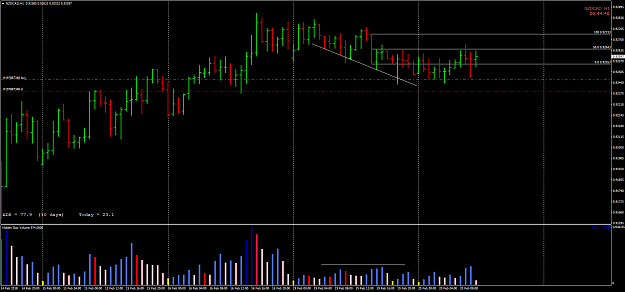
9:1 RR. The high RR trades are addictive, they forgive a lot of mistakes.
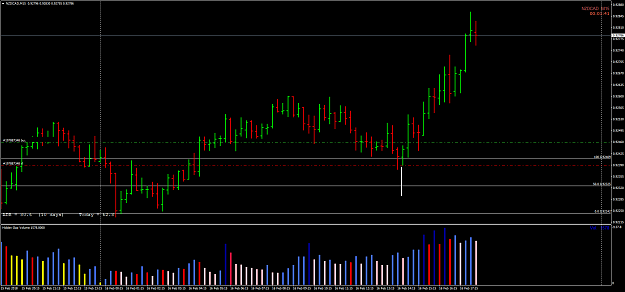
9:1 RR. The high RR trades are addictive, they forgive a lot of mistakes.
Attached Image(s) (click to enlarge)
2