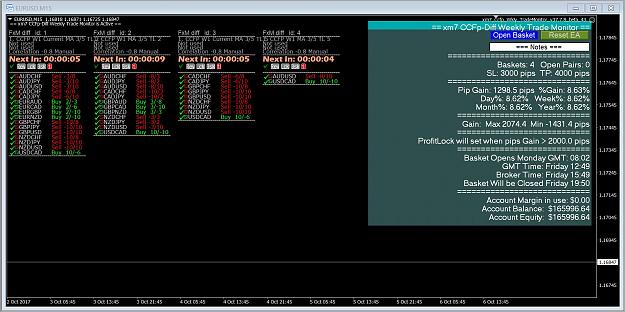
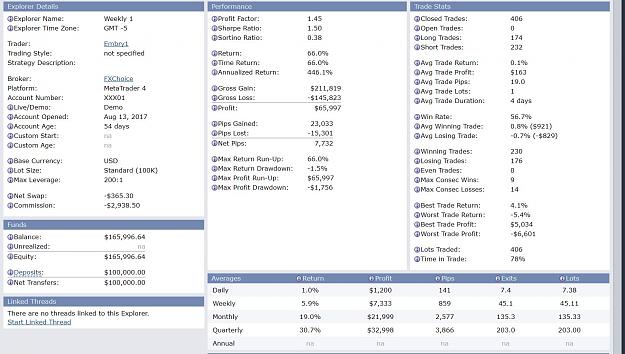
DislikedI encourage those who trade longer timeframes like weekly or monthly to use an equity graph indicator if you have not already. It helps you collect invaluable data and gives you a much clearer picture regarding DD, what causes it, the optimal time to start the basket etc. There are tons of ways to interpret these graphs Here's one example, I've noticed that on my weekly settings, the DD can be pretty big relative to the profit as shown in the graph below (Now keep in mind that this is a demo account, I could've closed the basket once profit hits...Ignored
Attached File(s)