- Search Forex Factory
- 19 Results
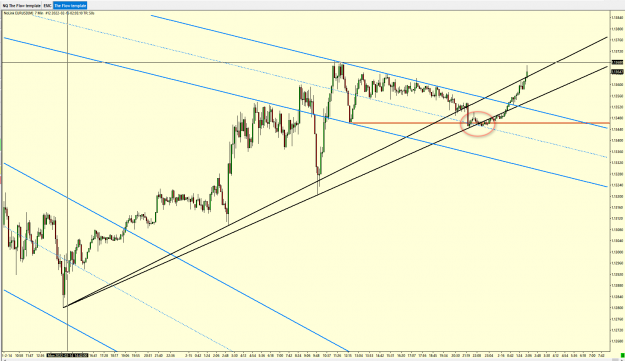
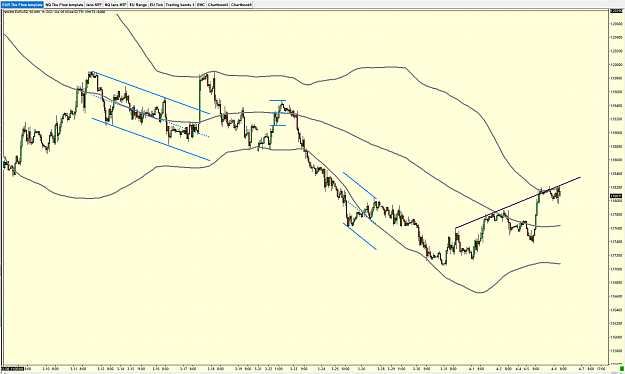
- rhk replied Feb 16, 2022
Hi moeinyzz, Ive attached a 7 min eur chart. I have your VTL on it and a second tline based on the 2nd higher low. ( I've been using that 2nd tline as it fits in better as a channel... for me ) I keep a close eye on the important swing lows/highs. ( ...
Analysis and Trading based on Envelopes, Waves, Cycles
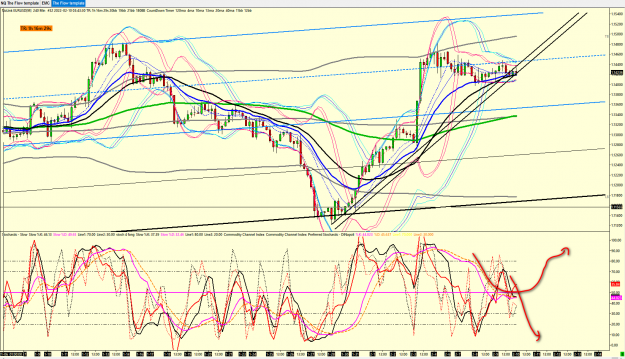
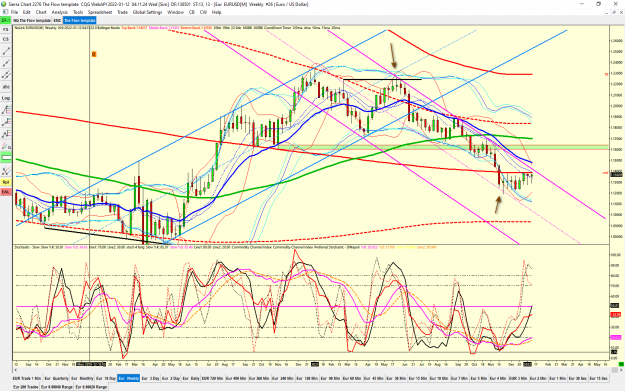
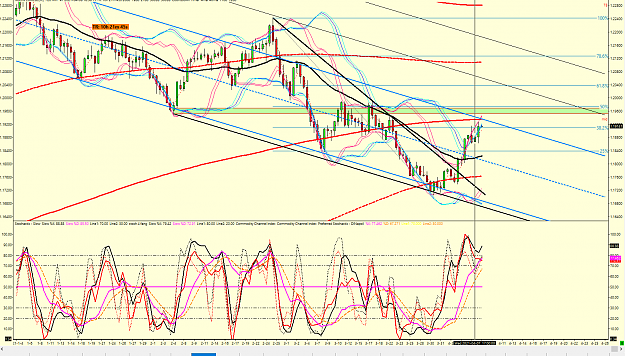
- rhk replied Feb 11, 2022
I did share what I was seeing..... MTHLY , 2 week and weekly charts want up and 3 day , 2 day , daily and 720 min want down. ie.. cycles in conflict. I was hoping for a follow thru candle on the weekly chart, to show that the mthly chart is about to ...
Analysis and Trading based on Envelopes, Waves, Cycles
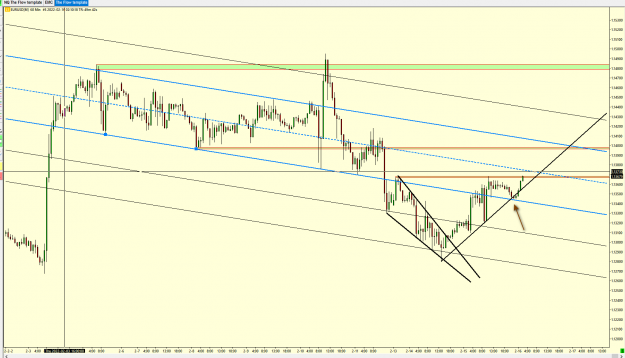
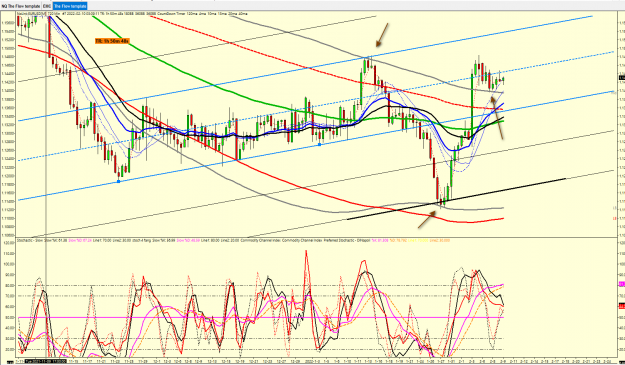
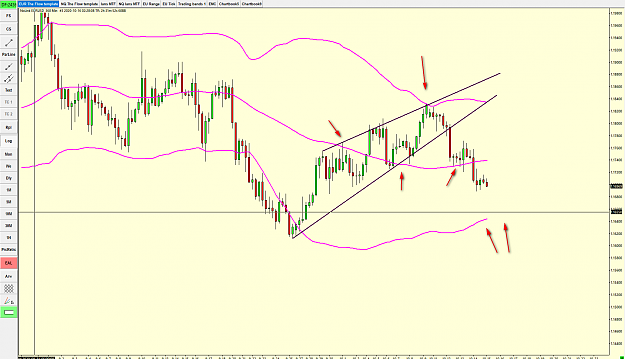
- rhk replied Feb 10, 2022
Will Eur 60 min break out of its channel ? 60 min cycle energy wants to turn down... ( stochastic)
Analysis and Trading based on Envelopes, Waves, Cycles
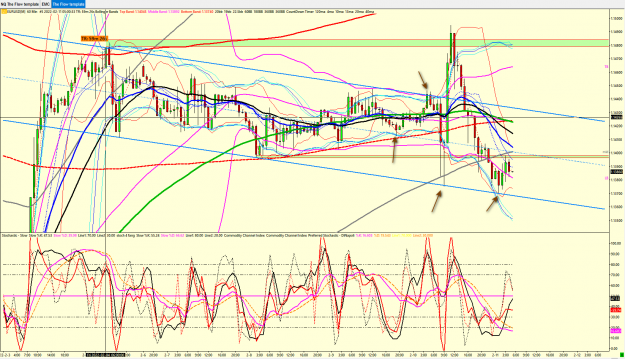
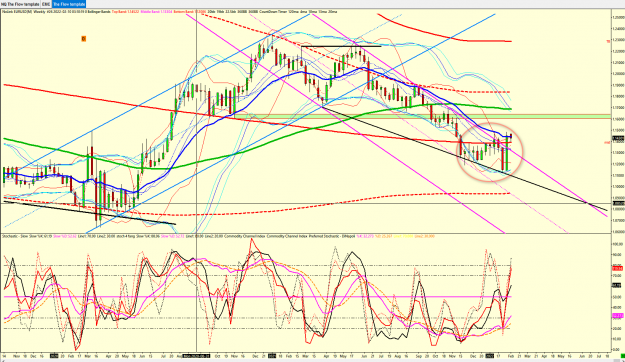
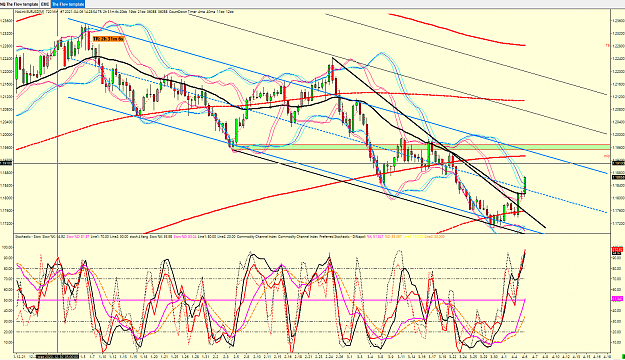
- rhk replied Feb 10, 2022
Updated weekly EUr.... circle shows a dbl bott. ... the 2 red candles down that gets reversed like this, ... seems bullish. 720 min chart shows a proven channel that broke down ( was a weak countertrend rally on the daily )...and bottomed on the ...
Analysis and Trading based on Envelopes, Waves, Cycles
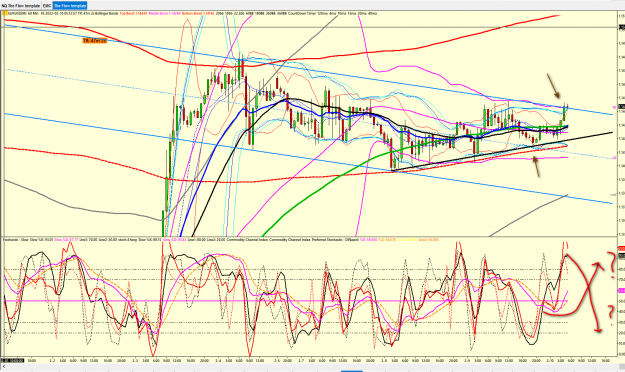
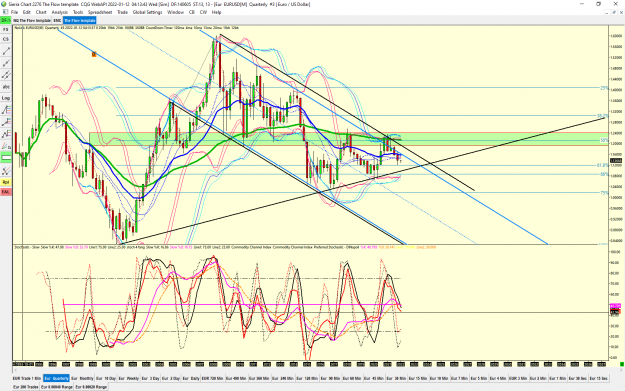
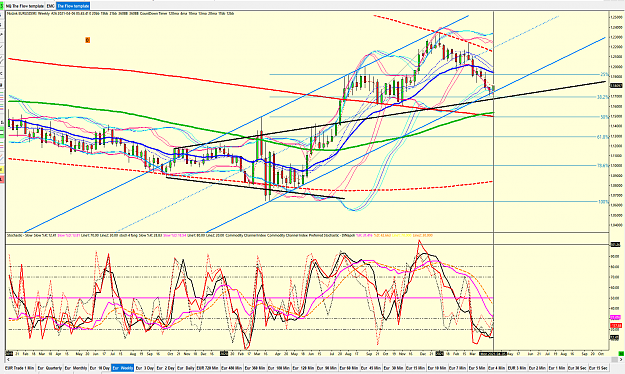
- rhk replied Jan 12, 2022
Hi all, About a yr ago I posted these charts to show how my version of hurst style stuff can work on much bigger time frames ( quarterly and weekly charts ) url url Attached are updated charts. Quarterly still has down side cycle "energy".... ...
Analysis and Trading based on Envelopes, Waves, Cycles
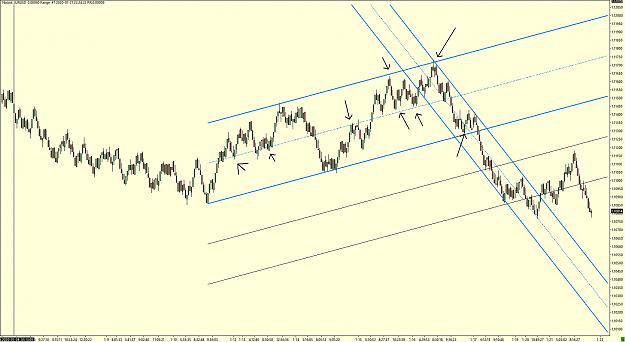
- rhk replied Apr 27, 2021
Ever heard of trendlines that only use 1 price action pivot/swing point of contact..?? Its a form of gann square which uses actual mkt swings to draw the t/lines. ( An old timer shared this with me... a few yrs ago.) I use this simple technique as a ...
Analysis and Trading based on Envelopes, Waves, Cycles
- rhk replied Apr 14, 2021
opps...wrong chart posted above....
Analysis and Trading based on Envelopes, Waves, Cycles
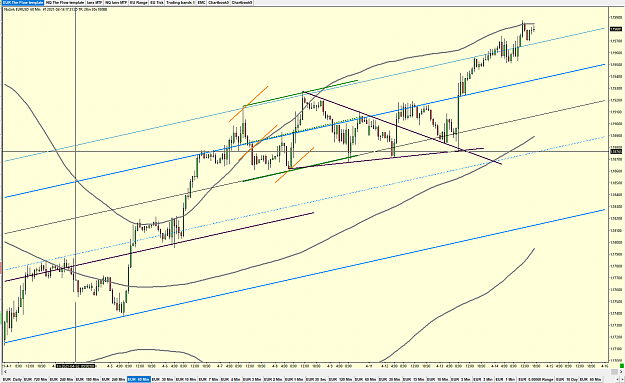
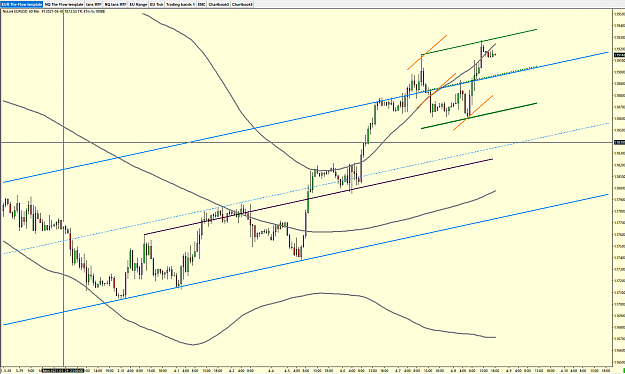
- rhk replied Apr 14, 2021
I do like simple charts..... Attached is a 60min eur chart. ( Ive added the 125% and 75% increments to the channel..... in the same way we divide a range by 8 ). The upper bb is enuf for me to try a short, if the retest fails ( ie.. dble top ...
Analysis and Trading based on Envelopes, Waves, Cycles

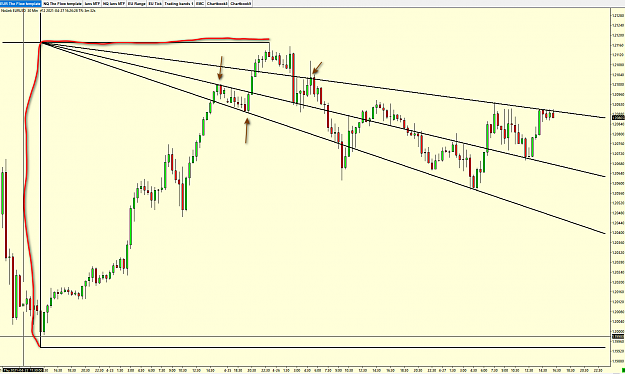
- rhk replied Apr 8, 2021
720min getting close to the outer channel line.
Analysis and Trading based on Envelopes, Waves, Cycles
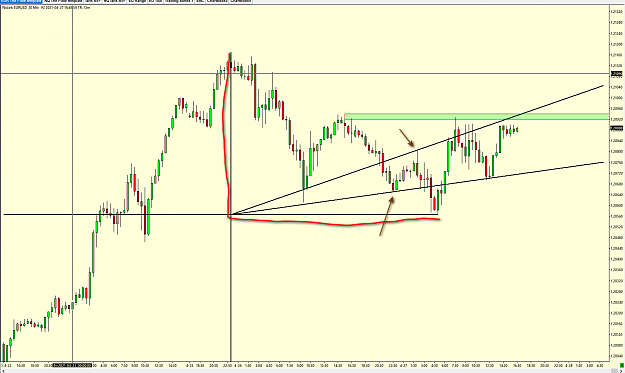
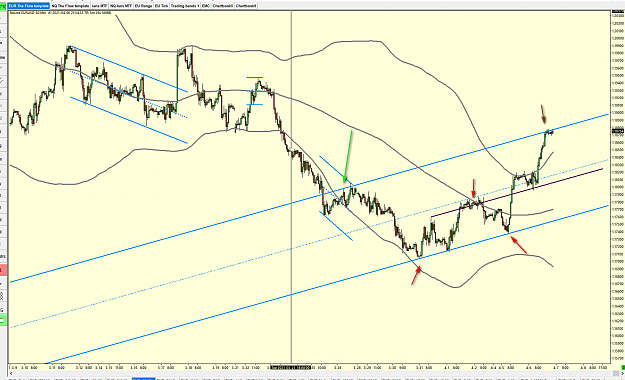
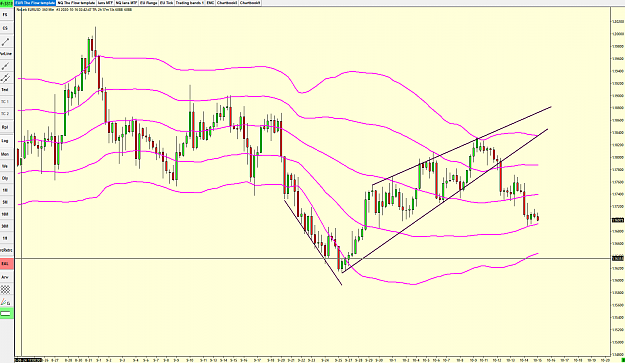
- rhk replied Apr 8, 2021
Attached is an updated 60min eur chart. Shows how PA is balancing around the upper BB and also the upper fixed channel line. From the 2 day chart down to the 60min...all the cycles want down. The weekly chart wants up. Maybe we can get a 1-2 day ...
Analysis and Trading based on Envelopes, Waves, Cycles
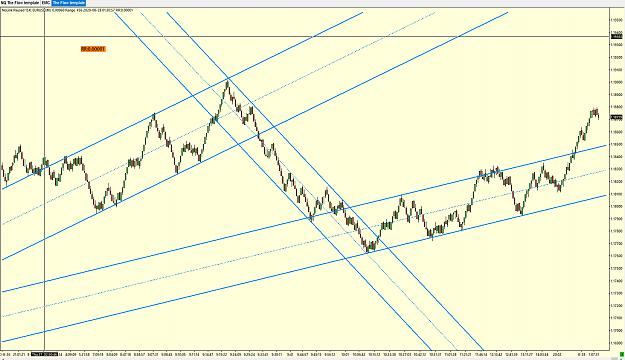
- rhk replied Apr 6, 2021
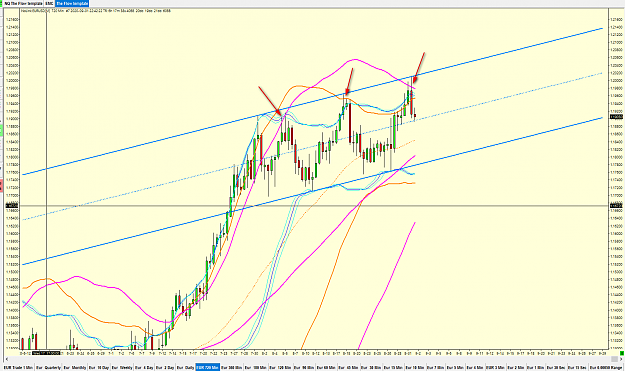
sometimes The midline of a possible channel can project where PA will hit resistance at a potential outer channel line. In this case the red arrows show the 3 points of contact I used to create a channel . The green arrow, to the left , helps ...
Analysis and Trading based on Envelopes, Waves, Cycles
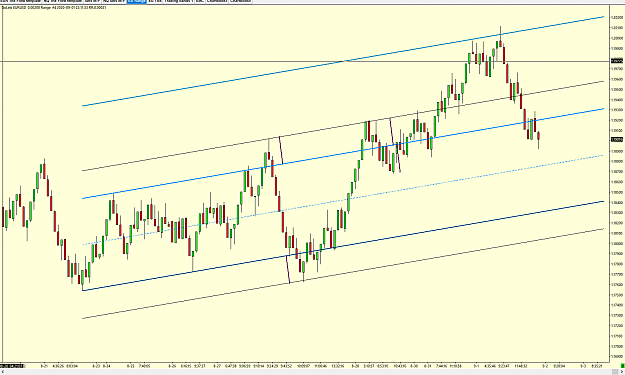
- rhk replied Apr 6, 2021
Parisboy... For me that consolidation on the 60min was a "pop or drop" level... Attched is the 720min chrt. For me...the daily/720 min swing is driving the trend on the 60 min - 240 min charts. The channel on the 720 min chart gave enuf to tell me ...
Analysis and Trading based on Envelopes, Waves, Cycles
- rhk replied Apr 6, 2021
Parisboy and swede have shown the magic of moving averages.. ( eg.. tillman forks etc..) I use the magic of MAs' in the form of bollinger bands. Attached chart show how useful they are. ( For me, cycles express themselves in the form of bands, ...
Analysis and Trading based on Envelopes, Waves, Cycles
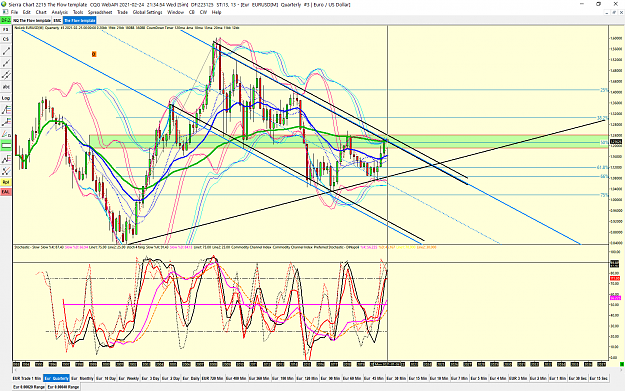
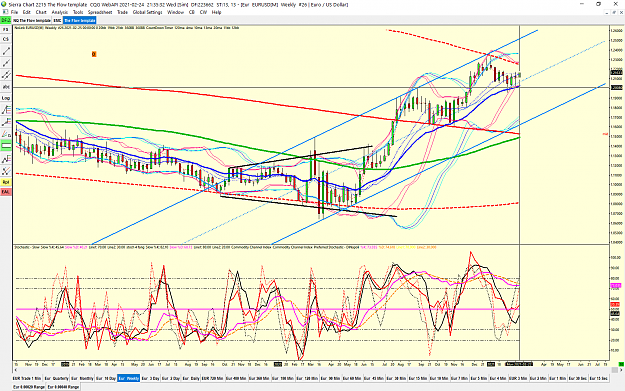
- rhk replied Feb 24, 2021
Attached is a quarterly eur/usd chart and also a weekly. I post this to show just how long term we can do this stuff on. ( Fundamentals become more important with long term charts ... in my view ). Also... In my experience... everything TA works... ...
Time and Price Forecasting
- rhk replied Oct 16, 2020
Here is a 360 min EUR It has a 60bb. The top for the current swing down came in at the top Bb. The mkt showed respect at the middle bb. The expectation ( prediction ) is that the mkt will go down to the lower bb. The 60 bb shows a mathematical ...
Analysis and Trading based on Envelopes, Waves, Cycles
- rhk replied Sep 1, 2020
Attached is a 720 min chart. Nice channel giving a potential topping pattern. The red arrows show , for me, the momentum/volatility aspect of cycles turning. From my study of Gann, I came to to idea that the influence of time on price can only be ...
Analysis and Trading based on Envelopes, Waves, Cycles
- rhk replied Sep 1, 2020
Parisboy, See link for an explanation of range bars url For me a range chart is an expression of space/time. It is a "price" chart. A "time" chart is our normal chart eg. 15 min, 1 hr charts etc. From watching live charts , over time, I've noticed ...
Analysis and Trading based on Envelopes, Waves, Cycles
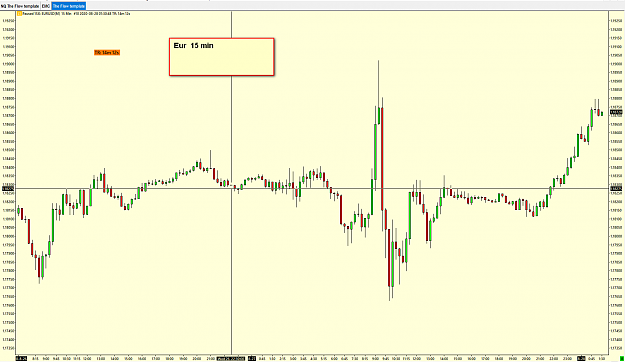
- rhk replied Aug 28, 2020
Hi Paris boy, A few yrs ago I had a Mentor who showed me the idea of "space- time". One example of that is a range chart ( time axis based on price), or a tick chart ( time function more related to volume )...etc. Attched is a 15min EUR showing the ...
Analysis and Trading based on Envelopes, Waves, Cycles
- rhk replied Jan 21, 2020
Hi everyone, This is a great thread. I'll add to the thread by way of this idea. there are 3 elements to a trade, which can be expressed in a chart in different ways. They are Price, Time and Volume. ( PTV) my view is that a more complete analysis ...
Time and Price Forecasting
- Posts by Member Search: 'rhk'