- Search Forex Factory
- 20 Results
- lakis071051 replied Apr 22, 2016
Hi, Some comments: MN: You are right. There is a D-Zone on the MN-Chart, like you draw it (09-10/2015) I think that, in the S-Zone (04-08/2015) you draw, you must include also the real body of all Basing Candles My MN-TL was wrong W1: I think the ...
Supply and demand in a nutshell by Alfonso Moreno
- lakis071051 replied Apr 21, 2016
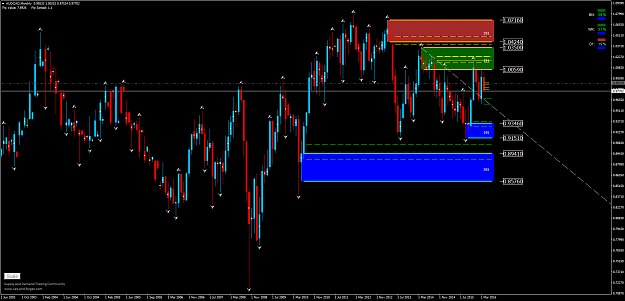
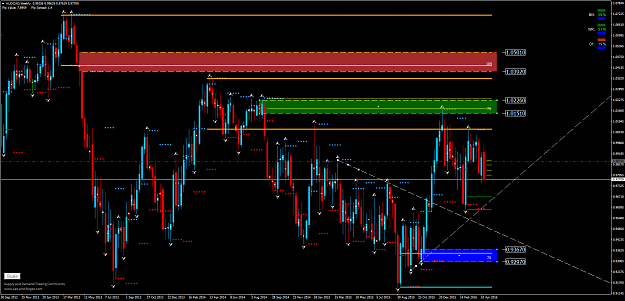
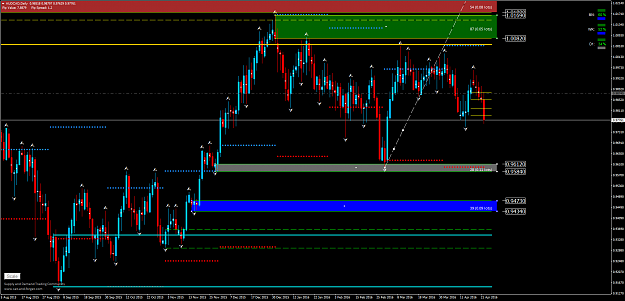
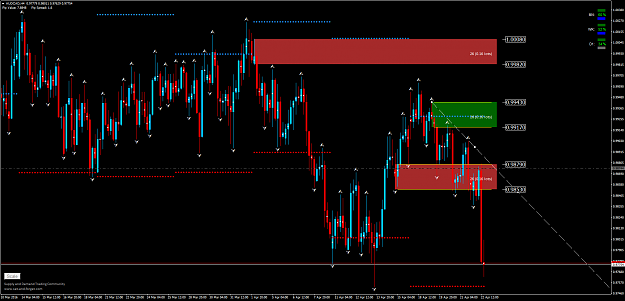
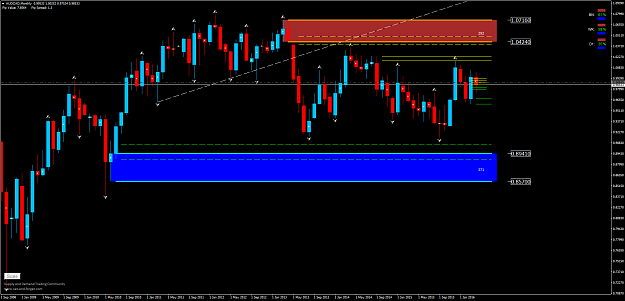
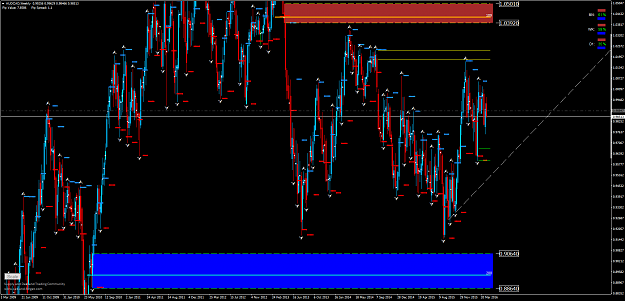
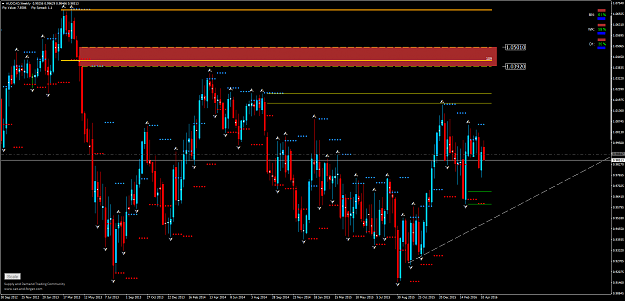
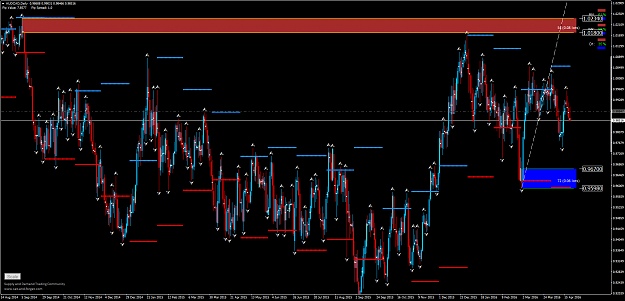
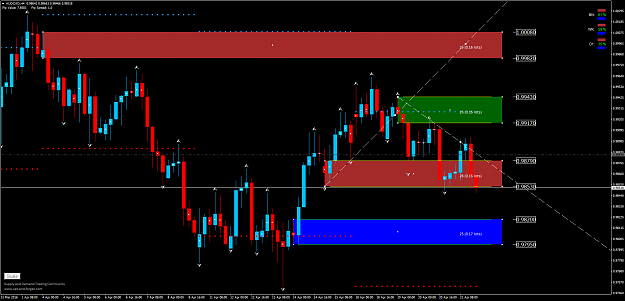
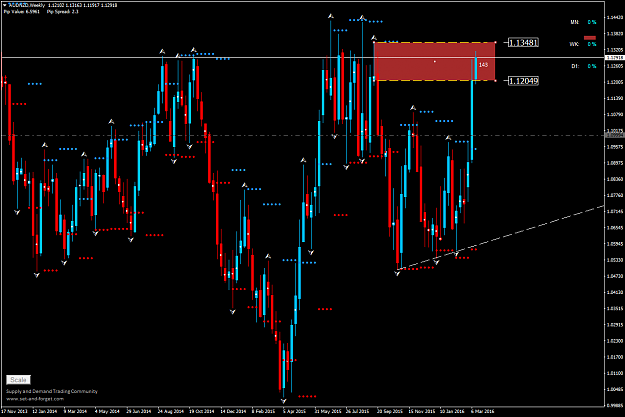
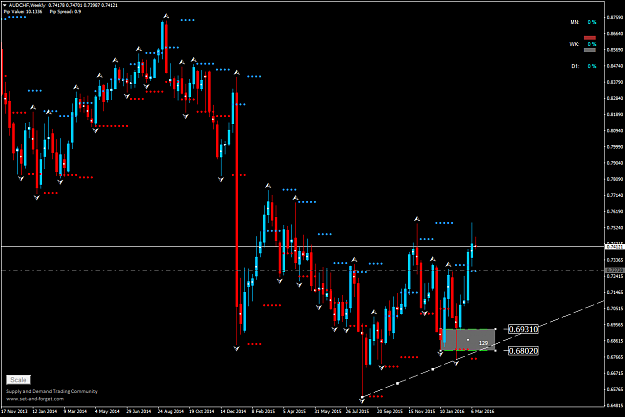
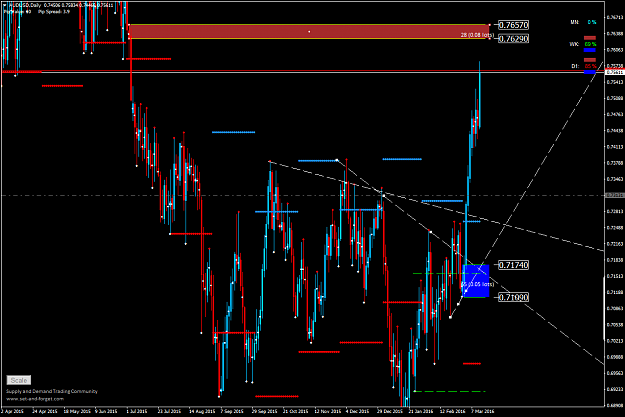
A top-down analysis in AUDCAD. MN-Trend is Up. Zones are drawn correctly? W1-Trend is Up. Zones are drawn correctly? W1-Supply almost inside MN-Supply D1-Trend is Up. Zones are drawn correctly? H4-Trend is Down? TL-Break & Take out of opposing ...
Supply and demand in a nutshell by Alfonso Moreno

- lakis071051 replied Mar 16, 2016
Any comment in the community?
Supply and demand in a nutshell by Alfonso Moreno
- lakis071051 replied Mar 15, 2016
What is happening if my Entry has hit and later the zone is broken. Do I stay in the trade?
Supply and demand in a nutshell by Alfonso Moreno
- lakis071051 replied Mar 15, 2016
In this case rectangle indi is showing the color of the zone correct. Any idea?
Supply and demand in a nutshell by Alfonso Moreno
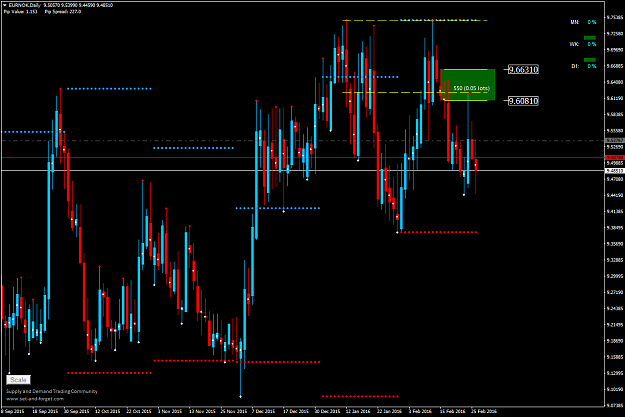
- lakis071051 replied Mar 15, 2016
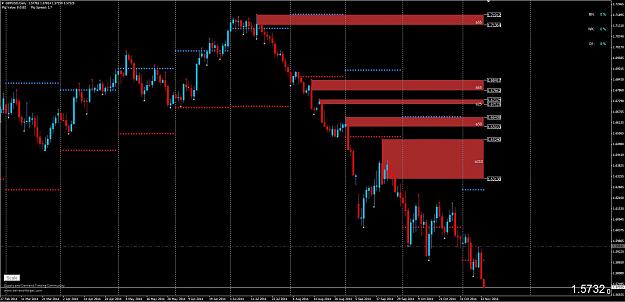
If the price is in the zone rectangle indi does not show correct the color of the zone. It should be green.
Supply and demand in a nutshell by Alfonso Moreno
- lakis071051 replied Mar 14, 2016
Is this a valid D-Zone on the WK-AUDCHF?
Supply and demand in a nutshell by Alfonso Moreno
- lakis071051 replied Mar 13, 2016
Do you mean this one?
Supply and demand in a nutshell by Alfonso Moreno
- lakis071051 replied Mar 13, 2016
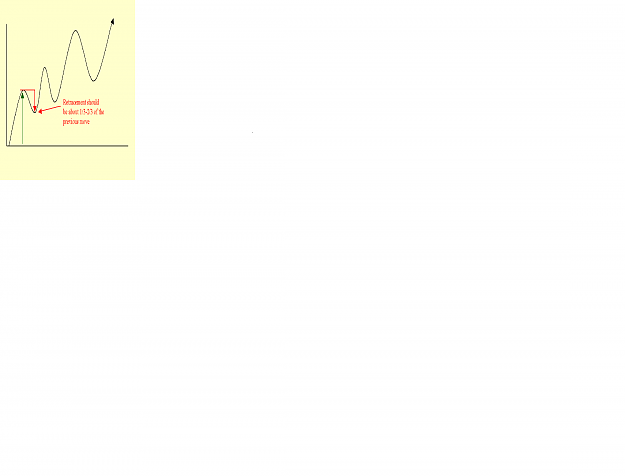
I think we must speak all the same "language". The definition in the international bibliography f. ex. Martin Pring is: "Valid peaks and troughs are created when the price moves to a new high or low for the move, or when a reaction to the ...
Supply and demand in a nutshell by Alfonso Moreno
- lakis071051 replied Mar 12, 2016
Excuse me Akt, At the moment I attached the charts I had a liitle problem with my browser. I attache them now Thanks image [attach]
Supply and demand in a nutshell by Alfonso Moreno
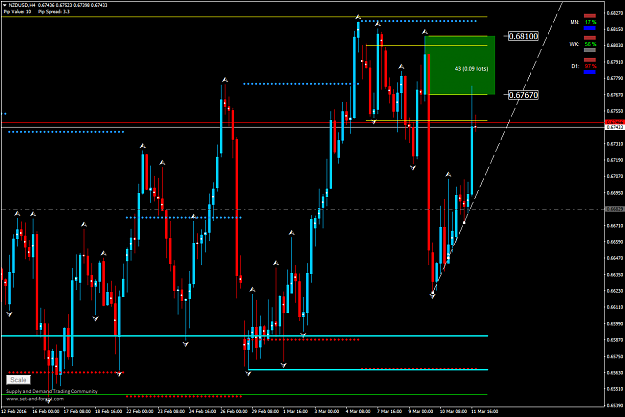
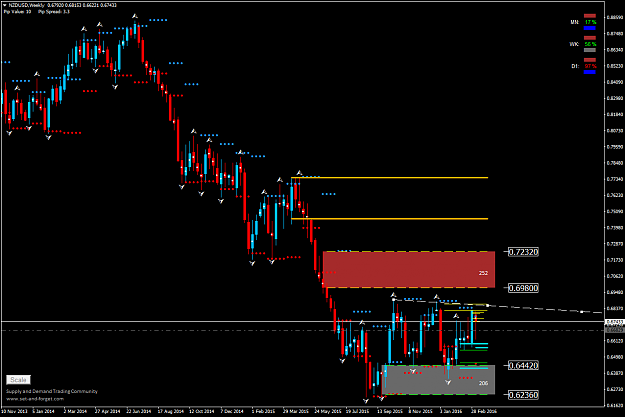
- lakis071051 replied Mar 12, 2016
Hi Akt, Hi John I believe, the Trend on the WK-NZD is Up. As per the rules, we use the 2 latest Picks or Valleys to draw a TL. In this case the latest of both is a Valley. We must connect this latest Valley with the previous one. Maybe I'm wrong. I ...
Supply and demand in a nutshell by Alfonso Moreno

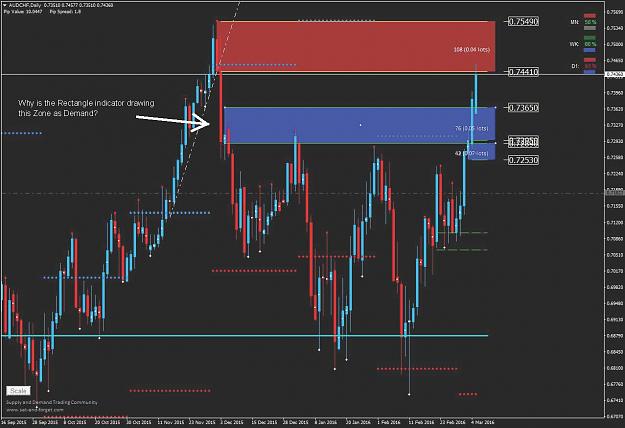
- lakis071051 replied Mar 7, 2016
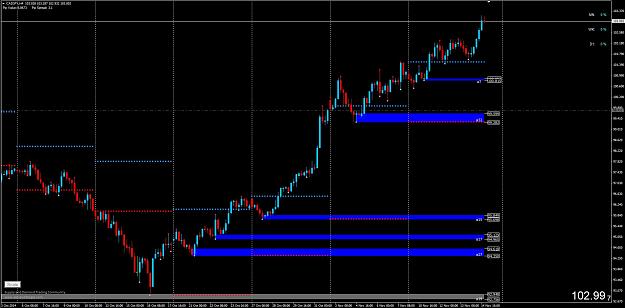
Why is the Rectangle indicator drawing this Level as Demand?
Supply and demand in a nutshell by Alfonso Moreno
- lakis071051 replied Feb 29, 2016
I see two different candles (first candle in the zone) in your charts. In the first chart without an upper wick and in the second with an upper wick. Different brokers? In the first chart you include the closing of the second candle in the zone. In ...
Supply and demand in a nutshell by Alfonso Moreno
- lakis071051 replied Feb 29, 2016
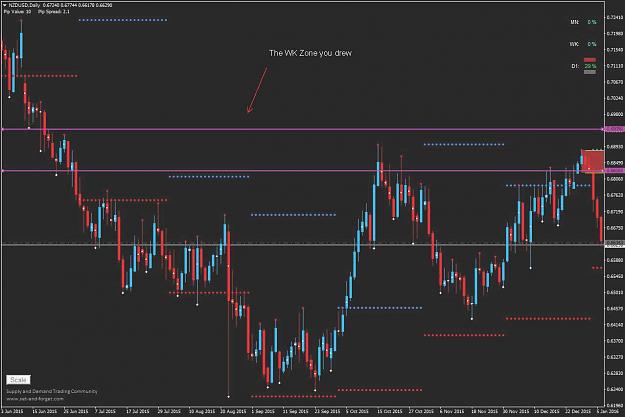
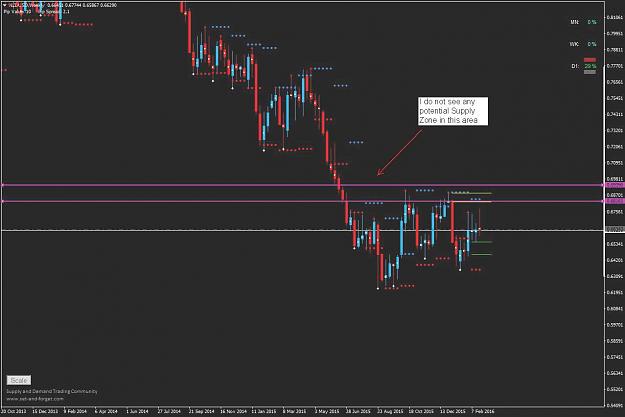
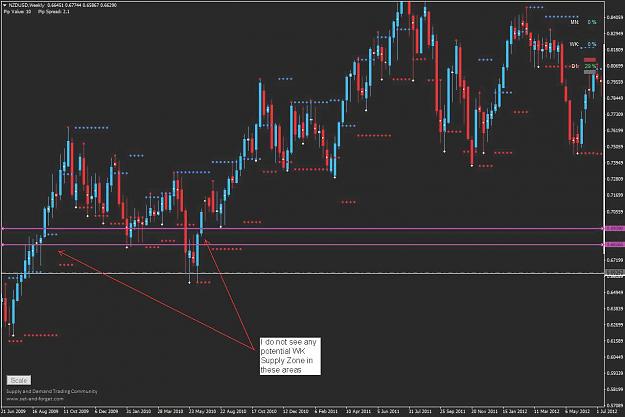
image image image How did you draw this WK Supply zone. I do not see in the WK chart any area where we could draw a potential Supply zone. I attach 3 charts.
Supply and demand in a nutshell by Alfonso Moreno
- lakis071051 replied Jan 14, 2015
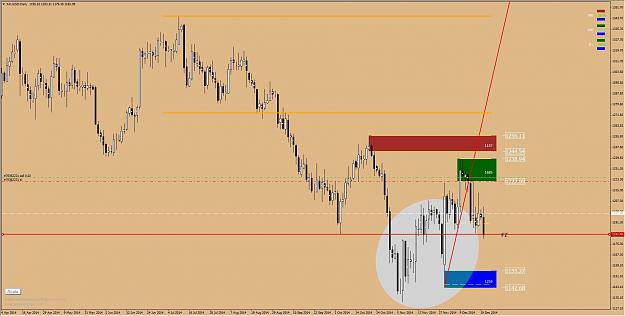
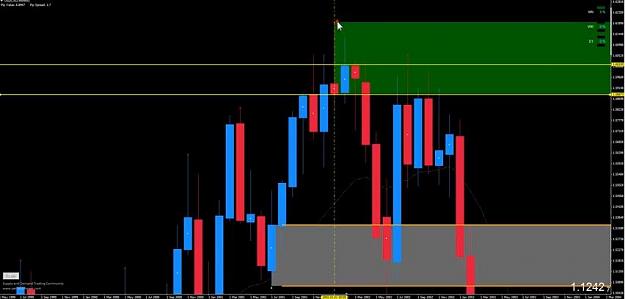
Hi Alfonso, How did you draw the Demand Zone (blue) on the following Gold chart (Rules)? Thanks
Supply and demand in a nutshell by Alfonso Moreno
- lakis071051 replied Nov 21, 2014
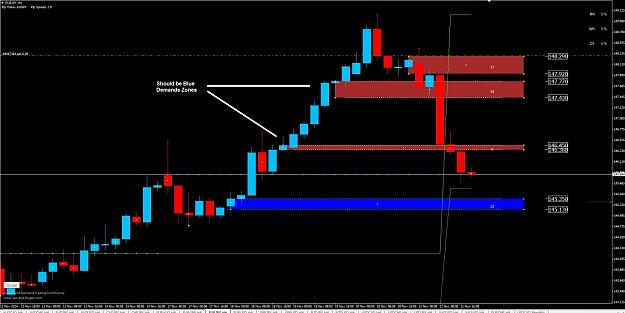
I have drew some SD-Areas on the attached chart. Are they correct? The 2 Zones after the Blue Demand Zone must be Demand Zones. Why are they shown as Supply Zones? I think something is wrong. Could you please give ma an advise? Thanks
Supply and demand in a nutshell by Alfonso Moreno
- lakis071051 replied Nov 20, 2014
I saw the video “How to Draw Supply and Demand trading levels and Trendlines in a mechanical way” Time: 18:47 and I have a question: You do not draw the lower level of the Supply Area at the open of the fourth big Basing Bullish Engulfing Candle, ...
Supply and demand in a nutshell by Alfonso Moreno
- lakis071051 replied Nov 15, 2014
Hello Alfonso, You wrote me that "Continuation Patterns are not detected by the indicator". I attache you a chart where I believe the indicator is drawing CPs (Blue). Are they not CPs. Maybe I'm wrong. Thanks, Cheers, Emmanuel
Supply and demand in a nutshell by Alfonso Moreno
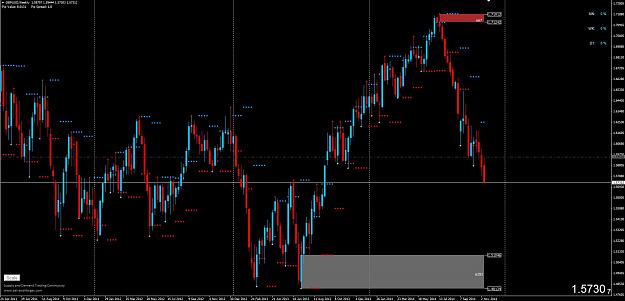
- lakis071051 replied Nov 13, 2014
Hi Alfonso, I received your informative email and I thank you. I have installed the indicators and the template but I do not see the same picture on W1 and MN GBPUSD chart of my MT4. 1. You have different Supply and Demand Zones on your chart. 2. On ...
Supply and demand in a nutshell by Alfonso Moreno
- Posts by Member Search: 'lakis071051'