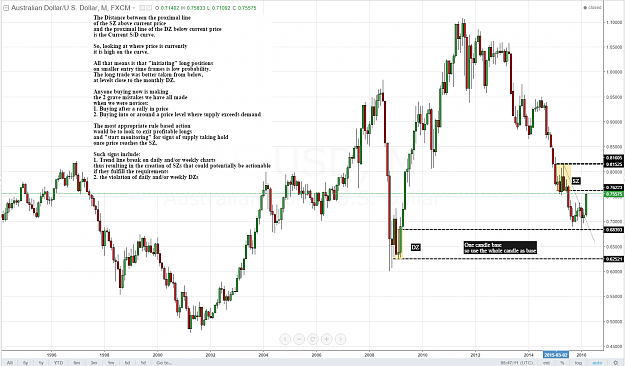
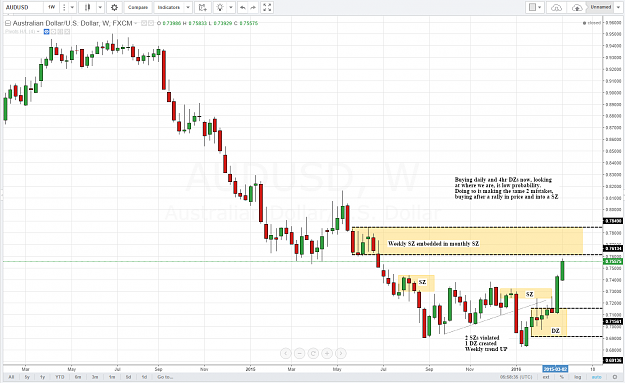
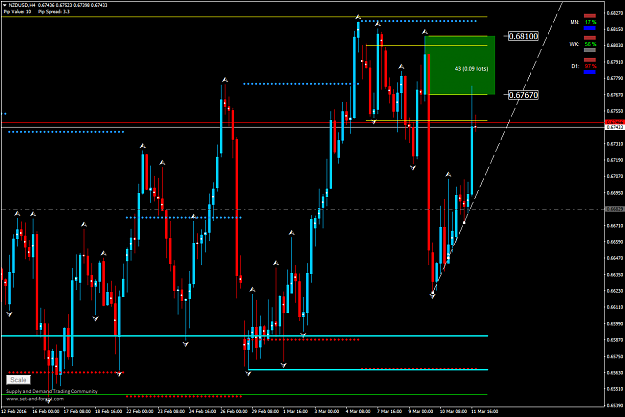
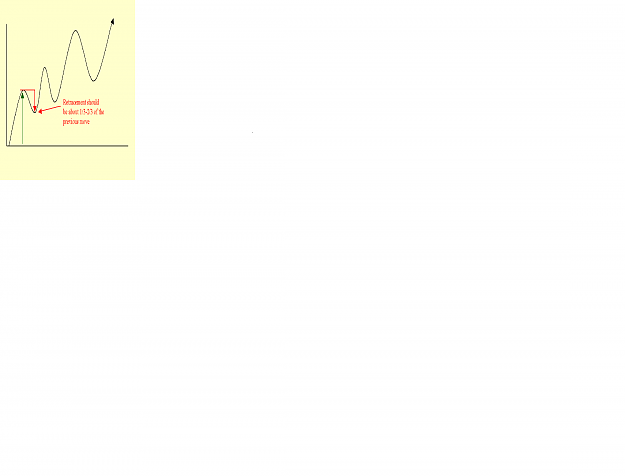
DislikedHi Akt, thanks for your post! Sorry but I can not agree with you. Your MN CP DZ can not control the market because this zone is against the trend. And CP against the trend can not be the zone in control. So on the MN chart supply controls the market and we are quite high on the MN curve (70%). This small WK SZ I rely on is valid because it removed WK DZ below, please see my chart. The WK DZ which was removed was valid because the nearest opposing zone was much higher (more than 3:1 and makes zones valid by itself). Best Regards, John. {image} Updated:...Ignored
Thank you for sharing your thoughts. Much appreciated.
Allow me to apologize beforehand for the length of my response, it will be longer than usual
I think it is important I explain my view a bit more, for clarity.
I think you are correct that the issue may well be a difference in broker quotes.
A couple of things i would like to mention:
With regards to whether a monthly CP can hold up a trend, i think there is some clarification that is needed about this.
You see, whether a zone is a CP (i.e RBR or DBD) or one of the other patterns (ie DBR and RBD) should not matter.
Remember what all 4 patterns represent - they are pictures of demand (RBR and RBD) and supply (DBD AND RBD).
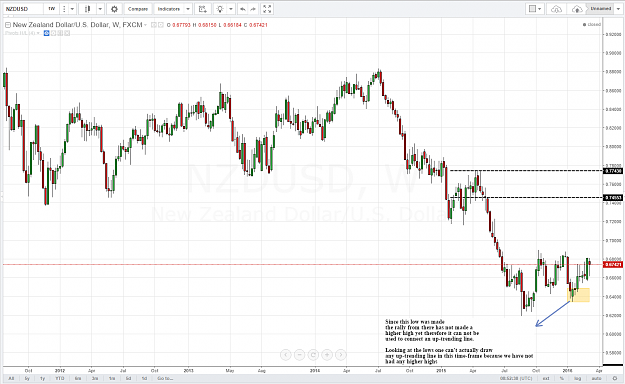
If we all subscribe to the view that the movement of price in any and all markets is governed by the laws of S&D then the one and only reason the downward movement in price in the NZD/USD has not continued for the last 7 months is because the selling is meeting with buying that has been enough to stall the downward draft of prices, even if temporarily.
There is no doubt the monthly is in a downtrend but the second question is that of location, where is that downtrend currently?
That will lead us into the discussion about THE CURVE (acronym for, the supply and demand curve).
The Current curve is the one I showed on my chart. The CP demand zone is yet to be violated. Prices have stalled out there for 7 months and all attempts thus far to take the NZD/USD lower has been matched by equivalent buying. Why? - it can only be because enough demand came in to stop the continued fall.
Curve identification has to do with identifying the fresh supply and fresh demand below current price
Trend is merely the movement of price from one larger time frame zone to another - in the case of an uptrend, the movement of price from a larger TF demand zone to a larger TF supply zone. As we are all position traders on this thread, the larger time frame for us will be the monthly chart.
Remember also that because the equation between supply and demand is always fluid, you will have even these larger time frame zones being broken as the equation plays out, thus leading to monster trends such as the one we have had since '09 in the stock markets in the world.
I would continue because I think the point you raise is vitally important but I fear this post is already the longest I have ever done and I worry i will lose people. It is not my intention to confuse others.
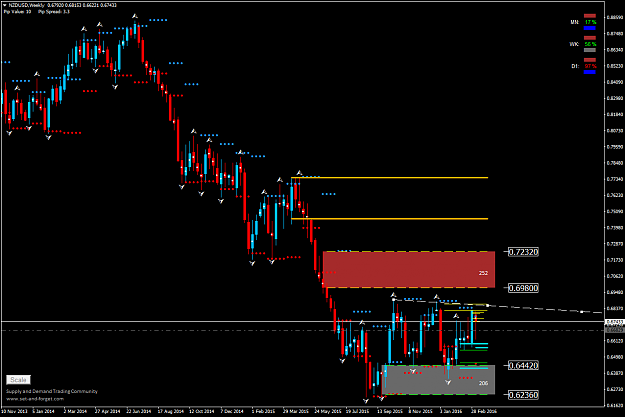
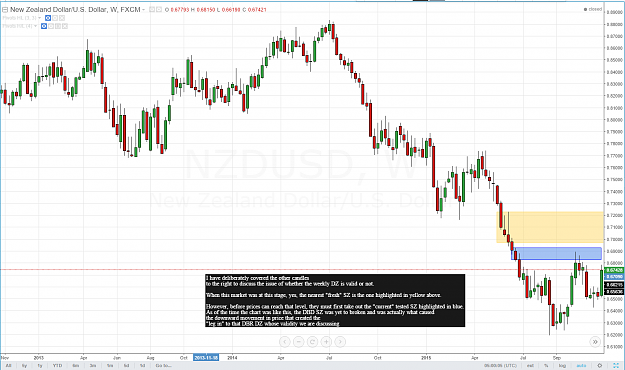
I have posted in the picture below, my thoughts about the weekly zone you discussed.
Attached Image (click to enlarge)
Best wishes
Be careful what you think because your thoughts run your life..Solomon