- Search Forex Factory
- 21 Results (2 Threads , 19 Replies )
- dangerman replied Apr 21, 2012
GBPAUD — Hi Everybody, So much going on with GBPAUD I just wanted to post up some charts and thoughts to see what you guys think. Price is now near the top of a long bearish channel or funnel type pattern on the weekly. Weekly HCR with ...
james16 Chart Thread
- dangerman replied Mar 22, 2012
sfp AUDCAD daily — SFP off trendline + off RN 1.0300 + Pinbar/w strong close. Target 150ema/PPZ
Fail Better
- dangerman replied Sep 20, 2006
Not sure, but I think it does because: The point marked A1 would have been the original low with with two higher lows on either side. As time progressed A2 is now the most recent low with two higher lows on either side. Point B is still the next ...
Mouteki Trading

- dangerman replied Sep 20, 2006
gbp/usd long — demoing long gbp/usd using s/l of 33% as per the new s/l rules of the method. The only problem I might have is moving stop to plus 10 when 40 pips in profit. Since a trade on the 4hr charts can last days this would seem hard to ...
Mouteki Trading
- dangerman replied Sep 14, 2006
Actually here's a chart with the most recent support line drawn also. If a short trade was taken and price moved against it there might be an opportunity to stop and reverse on an upward break of the resistance represented by the supply line.
Mouteki Trading
- dangerman replied Sep 14, 2006
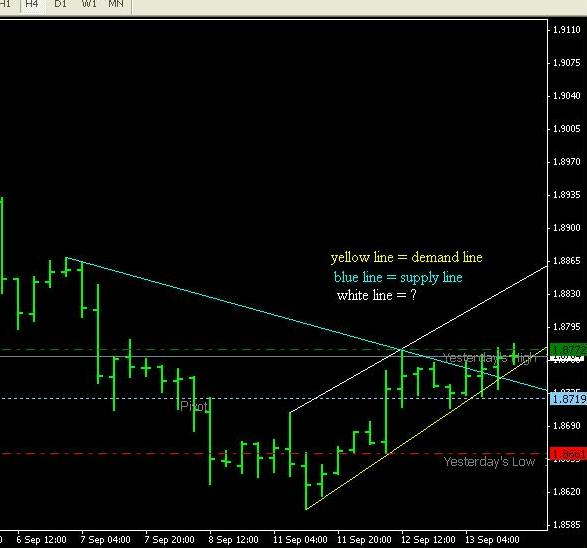
JG, This is my chart on the usd/jpy short breakout. The shaded bar is the bar that opened below the demand line. The highest high is the top vertical line 118.15, and the vertical line intersects the demand line at 117.01, which would give a target ...
Mouteki Trading
- dangerman replied Sep 13, 2006
slope of demand and supply lines? — Hi all, A question to the thread about the slope of demand and supply lines. In Mouteki's document he states clearly that "we construct an ascending line to represent demand and a descending line to ...
Mouteki Trading
- dangerman replied Sep 11, 2006
Looks like a good example of time triggering a trade possibly ahead of price action. The new 4hr bar that just opened is definately on the other side of the trendline. I'm not sure this would be as strong a signal to me than price itself moving up ...
Mouteki Trading
- dangerman replied Sep 11, 2006
I took the top of the bar from 9/11 08:00, then drew my trendline backwards to the the top of the bar on 9/7 00:00. The lowest low is 1.8602 as you say, and my horizontal line ended up at 1.8692, which comes out to exactly 90 pips by my figuring. ...
Mouteki Trading
- dangerman replied May 3, 2006
aud/usd weekly — Set a buy stop last friday above the resistance of the highs of the bars shown in the chart and a few pips above the 61 fib in case price bounced off. May add another buy stop above the resistance of the next level of bar ...
Aussie Pairs
- Problem with IBFX MT4 demo chartsStarted May 3, 2006|Platform Tech|8 replies
Anyone having a problem with ibfx mt4 demo charts? My platform updated to build 192 yesterday, and ...
- dangerman replied Apr 18, 2006
No posts to this thread for a while, but... — an observation and question. GBP/USD has surpassed the 3rd fib level and is headed for the 4th. Definitely time to sit up and take notice. At this point there is no trade because there is no price ...
Vegas Wealth Builder - Part I
- dangerman replied Oct 30, 2005
here's a picture of mine right now, not a lot going on, but seems ok to me Jimmy
InterbankFX down?
- dangerman replied Oct 25, 2005
Thats the one — Iso, thanks. I admit it wasn't the best pin bar, the eyes were definately a little far apart and it was in the middle of the trend lines, but the fact that it touched the ema and the fib, plus if I was right, price would move ...
More Newbie Trades
- dangerman replied Oct 24, 2005
short euro — Short eurusd at 1.1975. Playing 4hr pin bar that touched the 89 ema and 62 fib. It could have been closer to the trendline, but seems pretty good. See what happens Jimmy
More Newbie Trades
- More Newbie TradesStarted Oct 20, 2005|Trading Journals|4 replies
eastmaels, I think that is a great idea, so I think I'll do the same. I think posting my trades ...
- dangerman replied Sep 28, 2005
I think you are talking about the daily pin bar. Why is it dissapointing? I see what you mean about the tail not being long enough, but the bar after the pin bar (today's bar) only retraced about halfway down the tail. If a stop was set just under ...
james16 Chart Thread
- dangerman replied Sep 19, 2005
dbhlc — Hello All, dbhlc, went short at 1.8014, set stop at 1.8028 the high of the previous bar. Just looking at price action here. Anyone agree? Jimmy
GBPUSD
- dangerman replied Sep 6, 2005
Jim, If you look at my chart, it looks like it actually crossed the 365 ma 4 times? I would not have known when to get in here. Thanks I will keep a 365 ma on my charts and look for other opportunities. Jimmy
EURUSD