- Search Forex Factory
- 86 Results
- Leugimp replied May 12, 2008
I'll most likely be driving this at the end of the year!
Cesarnc's market talk, gossips, rumours & fun

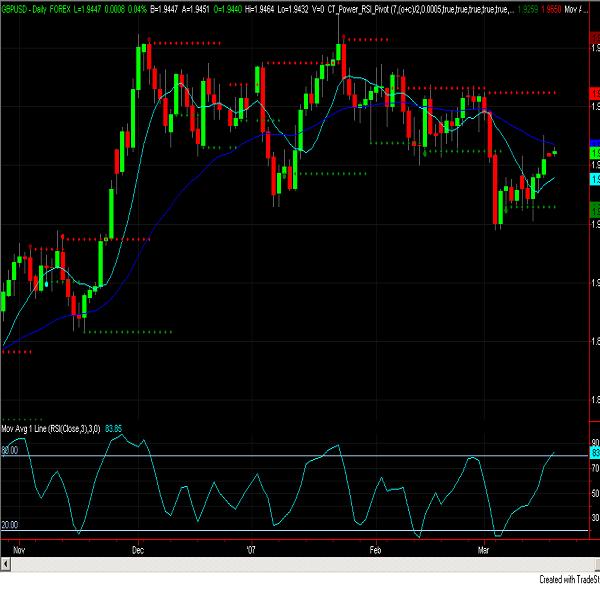
- Leugimp replied Mar 20, 2007
Today is a dangerous day to be entering on daily timeframe moves to the longside for GBPUSD. Not good idea when sma3rsi3 is above the 80 level.
Cable Update (GBPUSD)
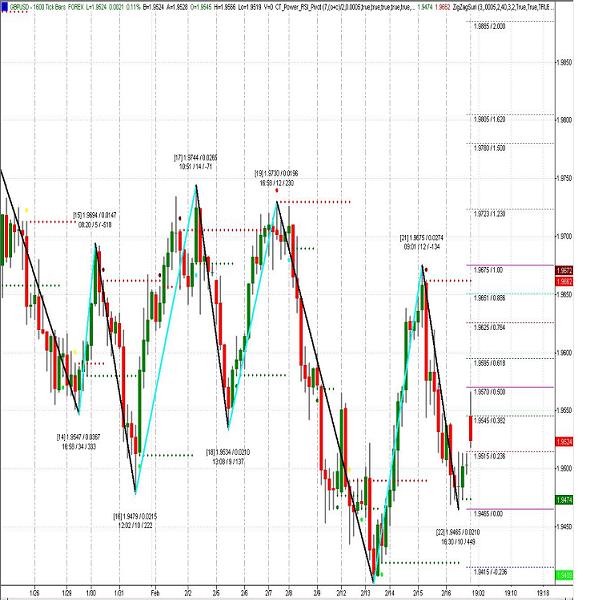
- Leugimp replied Feb 18, 2007
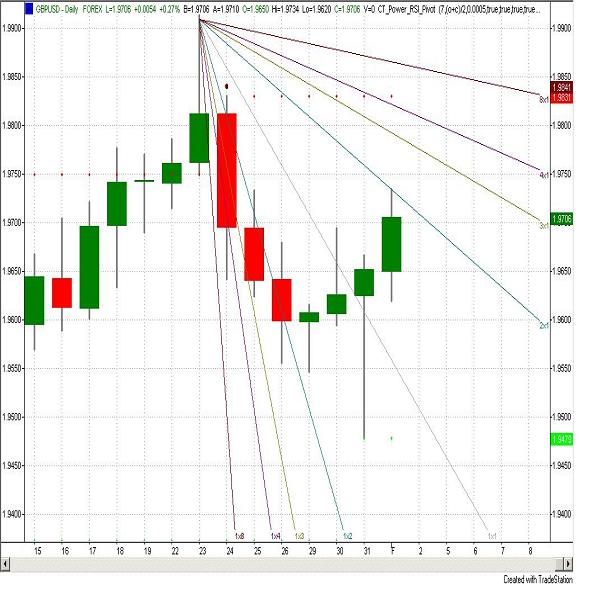
Here are extensions to upside(Green) and downside(Red), the fade was at the 38.2 extension which also happened to be the 50% retracement of most recent down move.
Cable Update (GBPUSD)

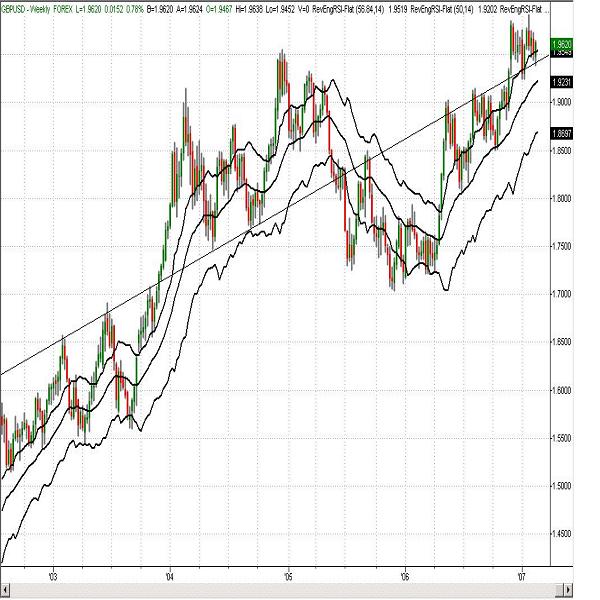
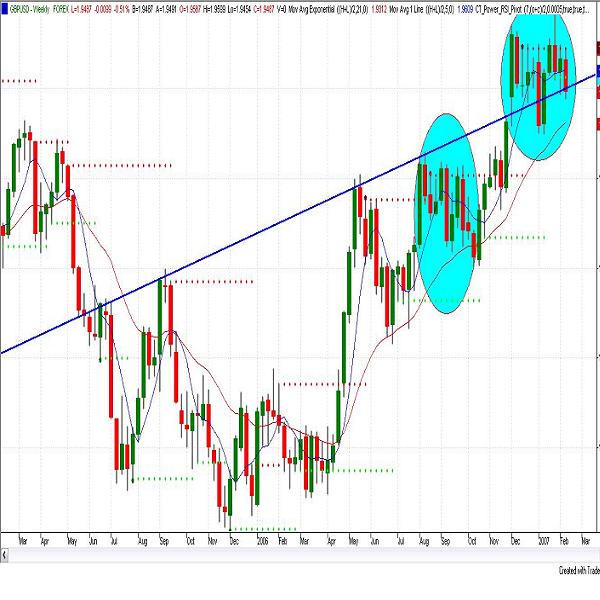
- Leugimp replied Feb 14, 2007
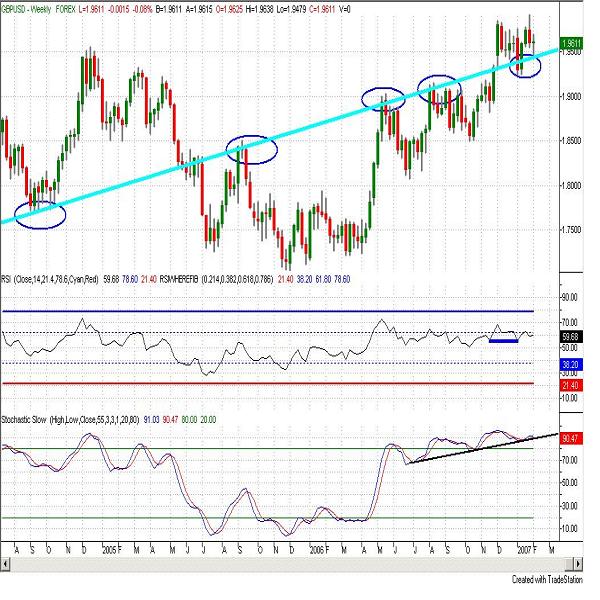
looks like we may have another weekly bounce off of long term uptrend trendline.
Cable Update (GBPUSD)
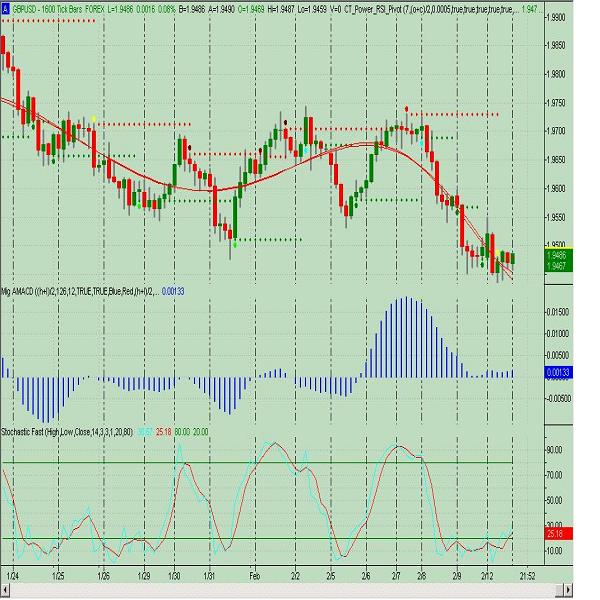
- Leugimp replied Feb 12, 2007
This is probaby going to be the ugliest chart i have posted of yet, but i have been working on a different format for MACD using quickly adapting MAS as opposed to exponential avgs. I have noticed that big moves occur when this indicator diverges ...
Cable Update (GBPUSD)
- Leugimp replied Feb 12, 2007
This thing just doesn't want to move up - I'm holding strong though - waiting to profit @9550 and willing to short only @ 9583 - 50% level of this swing. Also, this level will be consistent with strong negative reversal setup as well.
Cable Update (GBPUSD)

- Leugimp replied Feb 9, 2007
I hate to beat a dead horse, but i still believe the bias is to upside. Many similar characteristics between these 10 weeks and ten ranging weeks at end of last year. Unless we can have another close below this trendline next week, I am under the ...
Cable Update (GBPUSD)
- Leugimp replied Feb 9, 2007
Forex gods were with me yesterday as my sl missed by 1 pip and was able to get out b/e. As for today, can't stand fridays but as far as weeklys concerned, we are at a key level - todays and mondays action should give us a good clue as to where we go ...
Cable Update (GBPUSD)
- Leugimp replied Feb 6, 2007
Here is the pic of the two most recent positive reversals on the weeklys for cable - the most recent one projects price up to 2.0100 level in the minimum.
What's the use with RSI, STOCH, CCI?
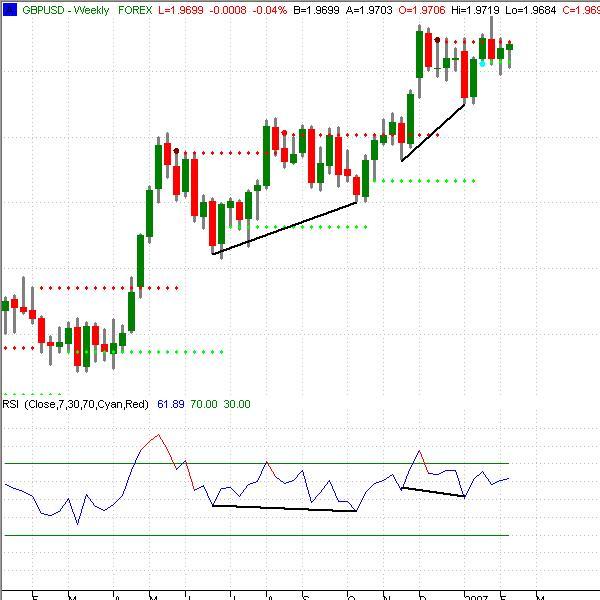
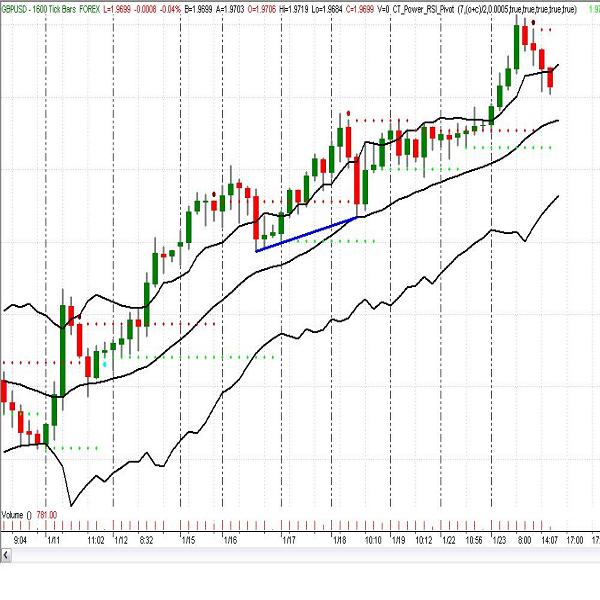
- Leugimp replied Feb 6, 2007
This second pic shows a confirmed positive reversal. Notice how price(where the blue trend line lies) is experiencing a higher low. Notice the higher low and how it touches the rsi 50 reverse engineered line. What this tells me is that the original ...
What's the use with RSI, STOCH, CCI?
- Leugimp replied Feb 6, 2007
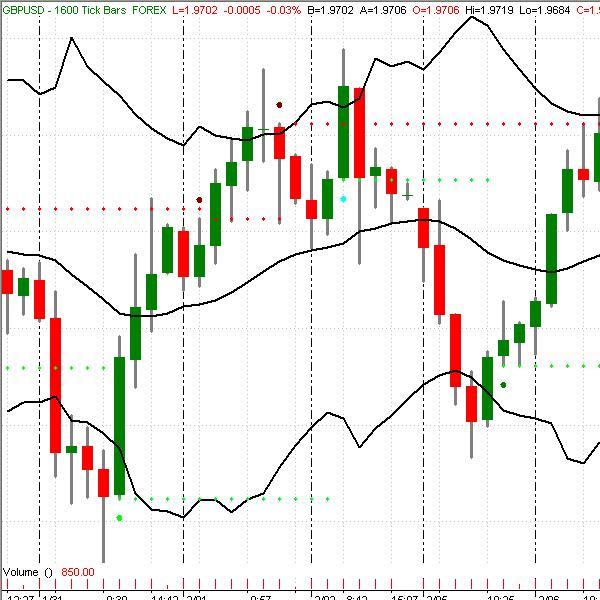
Contrary from popular belief, RSI can be very helpful in descerning trending or ranging markets and is extremely helpful in trading each. First off, we need to forget classic overbought and oversold levels. What you will notice is that there will be ...
What's the use with RSI, STOCH, CCI?
- Leugimp replied Feb 1, 2007
For better accuracy on Gann and Fib, do not use spike highs and lows. I cant believe I did this, cost me an easy 30 pips as adjustment to gann Fann at correct level nailed the 9734 high before the sharp move back down. The pic shows the correct Gann ...
Daily Cable Analysis
- Leugimp replied Jan 31, 2007
The important thing from the release is this - other than another piece to the puzzle for longer term view. The release will bring in some quick liquidity. Coupled with our TA, how can this liquidity be exploited for some good pips assuming that ...
Daily Cable Analysis
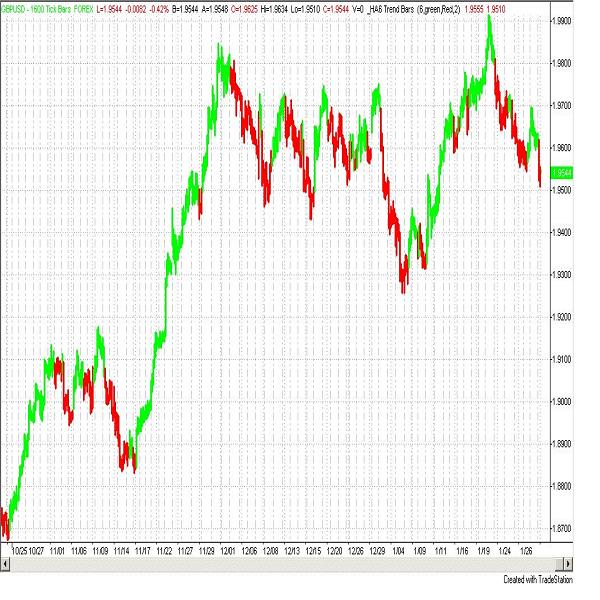
- Leugimp replied Jan 31, 2007
....I like to keep Heiken _Ashi candles up in the background as well, really good visual on what current trend may be. Here is a pic...
Daily Cable Analysis
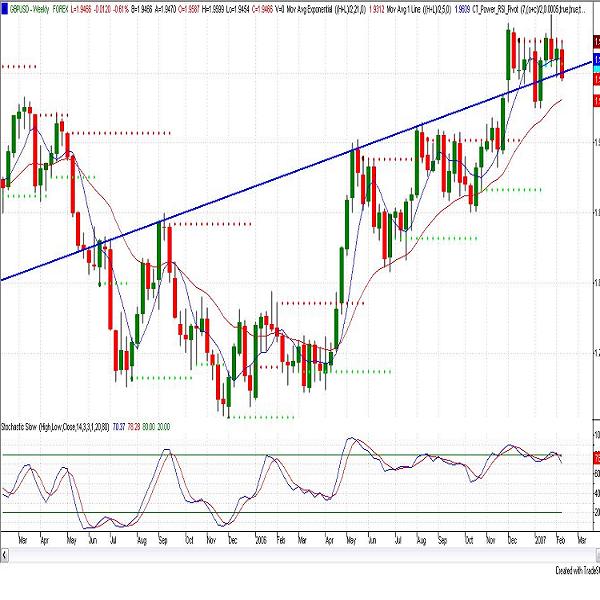
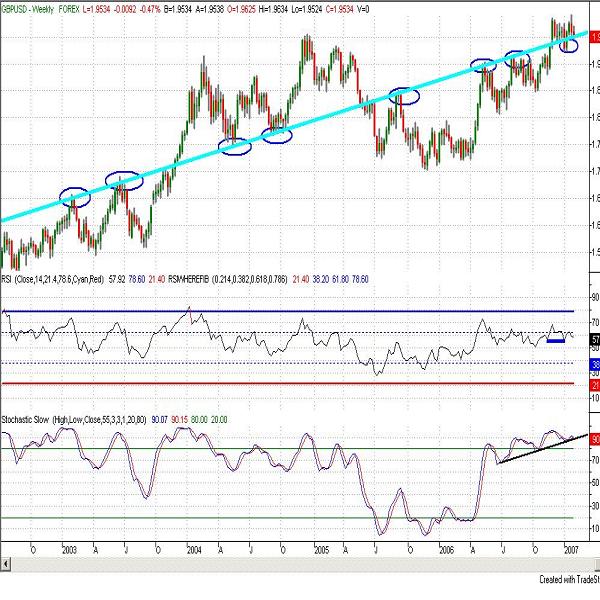
- Leugimp replied Jan 31, 2007
We are approaching this trendline once again on the weeklys, should provide good support until a decision is made at news time.
Daily Cable Analysis
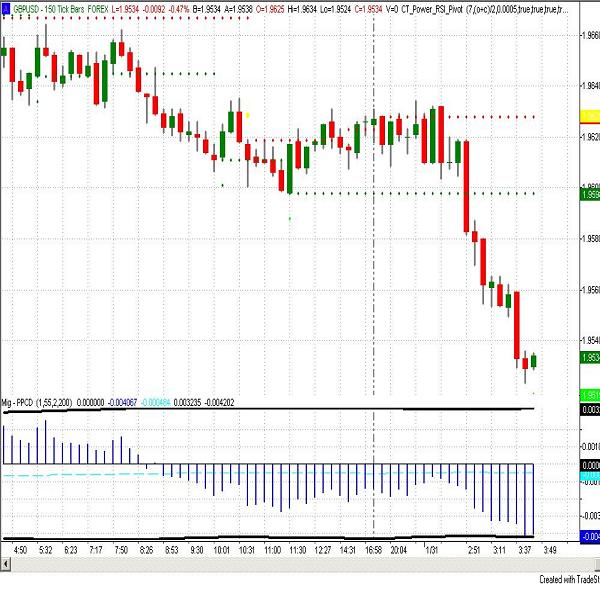

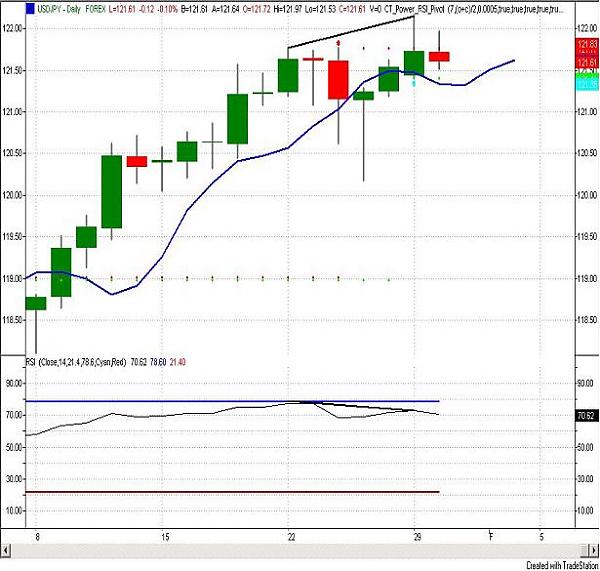
- Leugimp replied Jan 30, 2007
here is chart of usd/jpy if we can manage a close below 121.34 today or 121.31 tomorrow, the classic double repo pattern will be confirmed with price divergence. This is a very strong leading directional pattern on the daily charts signifying some ...
Daily Cable Analysis
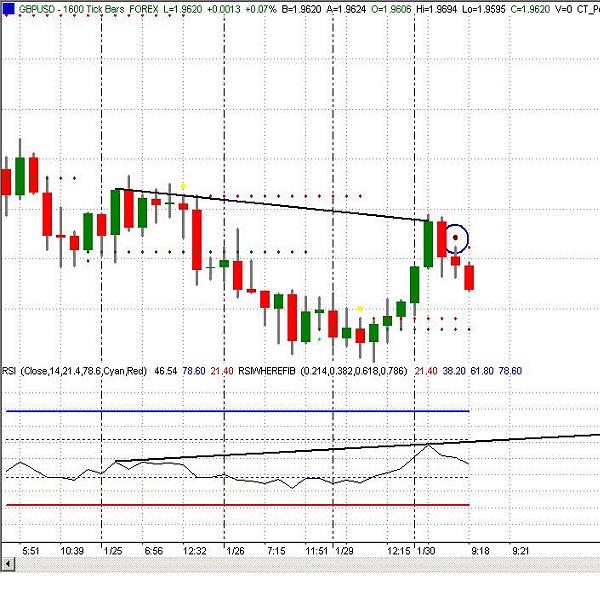
- Leugimp replied Jan 30, 2007
that red dot in the circle tells me so - LOL its the recent pivot confirmation in RSI and price. The high of the candle did not touch or exceed any rsi level equaling the previous two as well as two consecutive lower highs in price. The overall ...
Daily Cable Analysis