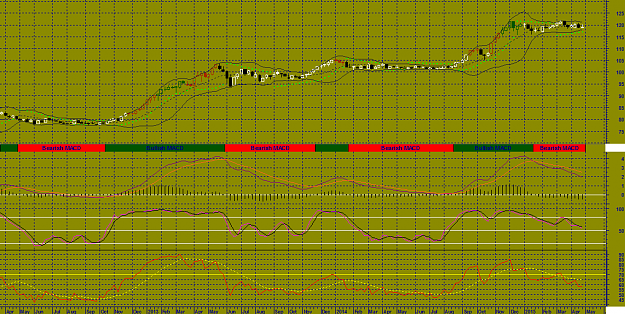
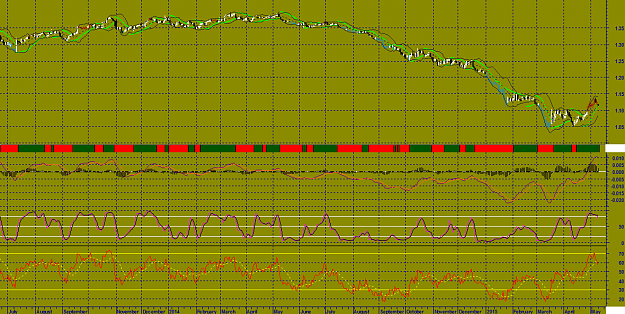
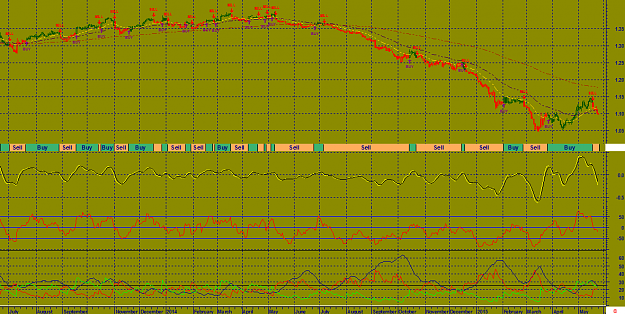
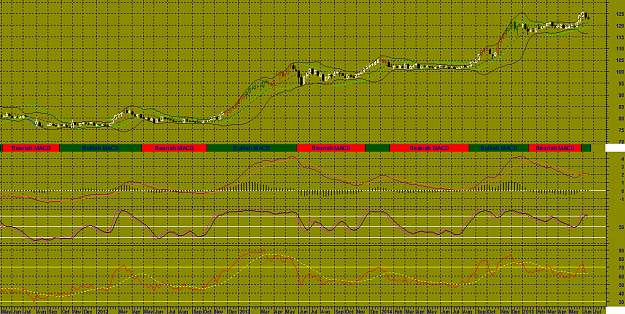
USD/JPY WEEKLY as of Monday, 27 April, 2015
A white body has formed as prices closed higher than open.
The previous 10 candlestick bars, there are 7 white candles versus 3 black candles with a net of 4 white candles.
The previous 50 candlestick bars, there are 32 white candles versus 18 black candles with a net of 14 white candles.
A long upper shadow has formed. This is typically a bearish signal (particularly when it occurs near a high price level, at resistance level, or when the security is overbought).A spinning top has formed which is a candle with a small real body. Spinning tops identify a session in which there is little price action as defined by the difference between the open and the close. During a rally or near new highs, a spinning top can be a sign that prices are losing momentum and the bulls may be in trouble.MACD is BEARISH as the MACD is below the signal line.
The MACD crossed below the signal line 13 period(s) ago. Since the MACD crossed the MACD moving average, US Dollar / Japanese Yen's price has increased 1.02%, and has been fluctuating from a high of 122.015 to a low of 116.873.
The MACD is currently not in an Overbought/Oversold range.
There have been no divergence signals during the last 5 periods.
No Stochastic Buy or Sell signals generated today. The last signal was a Sell 128 Period(s) Ago.
The RSI is not currently in a topping (above 70) or bottoming (below 30) range. A buy or sell signal generated when the RSI moves out of an overbought/oversold area. The last signal was a Sell 5 period(s) ago.
Currently the RSI does not show any Failure Swings. The RSI and price of US Dollar / Japanese Yen are not diverging.
Currently, the Momentum Oscillator does not show an overbought or oversold condition.
The last Directional Movement Indicators (DMI) signal was a SELL 83 period(s) ago.
There were no SAR signals generated today. The last SAR signal was a Buy 7 period(s) Ago.
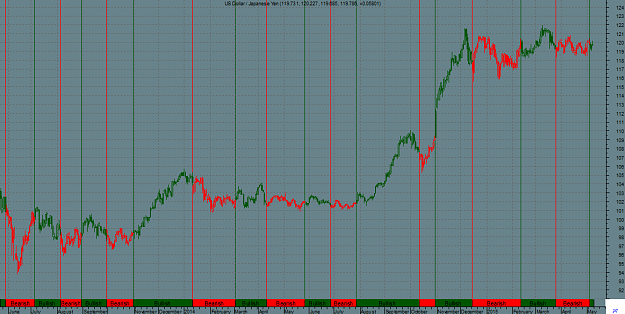
The close is currently
ABOVE its 200 weekly moving average
ABOVE its 50 weekly moving average
ABOVE its 20 weekly moving average
The current market condition for US Dollar / Japanese Yen is Very Bullish
US Dollar / Japanese Yen closed above the lower Bollinger Band by 42.1%. Bollinger Bands are 53.41% narrower than normal. The narrow width of the Bollinger Bands suggests low volatility as compared to US Dollar / Japanese Yen's normal range. Therefore, the probability of volatility increasing with a sharp price move has increased for the near-term. The Bollinger Bands have been in this narrow range for 3 period(s). The probability of a significant price move increases the longer the Bollinger Bands remain in this narrow range.
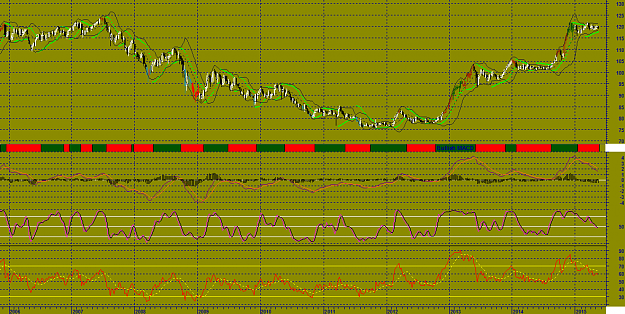
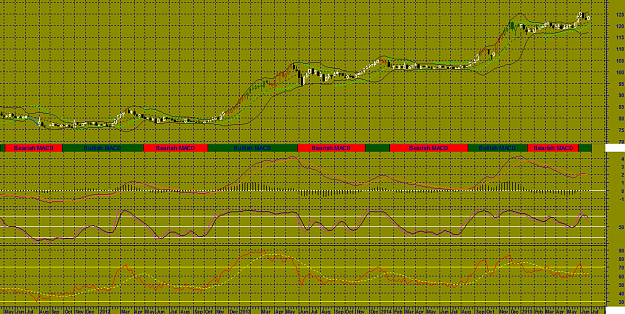
A white body has formed as prices closed higher than open.
The previous 10 candlestick bars, there are 7 white candles versus 3 black candles with a net of 4 white candles.
The previous 50 candlestick bars, there are 32 white candles versus 18 black candles with a net of 14 white candles.
A long upper shadow has formed. This is typically a bearish signal (particularly when it occurs near a high price level, at resistance level, or when the security is overbought).A spinning top has formed which is a candle with a small real body. Spinning tops identify a session in which there is little price action as defined by the difference between the open and the close. During a rally or near new highs, a spinning top can be a sign that prices are losing momentum and the bulls may be in trouble.MACD is BEARISH as the MACD is below the signal line.
The MACD crossed below the signal line 13 period(s) ago. Since the MACD crossed the MACD moving average, US Dollar / Japanese Yen's price has increased 1.02%, and has been fluctuating from a high of 122.015 to a low of 116.873.
The MACD is currently not in an Overbought/Oversold range.
There have been no divergence signals during the last 5 periods.
No Stochastic Buy or Sell signals generated today. The last signal was a Sell 128 Period(s) Ago.
The RSI is not currently in a topping (above 70) or bottoming (below 30) range. A buy or sell signal generated when the RSI moves out of an overbought/oversold area. The last signal was a Sell 5 period(s) ago.
Currently the RSI does not show any Failure Swings. The RSI and price of US Dollar / Japanese Yen are not diverging.
Currently, the Momentum Oscillator does not show an overbought or oversold condition.
The last Directional Movement Indicators (DMI) signal was a SELL 83 period(s) ago.
There were no SAR signals generated today. The last SAR signal was a Buy 7 period(s) Ago.
The close is currently
ABOVE its 200 weekly moving average
ABOVE its 50 weekly moving average
ABOVE its 20 weekly moving average
The current market condition for US Dollar / Japanese Yen is Very Bullish
US Dollar / Japanese Yen closed above the lower Bollinger Band by 42.1%. Bollinger Bands are 53.41% narrower than normal. The narrow width of the Bollinger Bands suggests low volatility as compared to US Dollar / Japanese Yen's normal range. Therefore, the probability of volatility increasing with a sharp price move has increased for the near-term. The Bollinger Bands have been in this narrow range for 3 period(s). The probability of a significant price move increases the longer the Bollinger Bands remain in this narrow range.
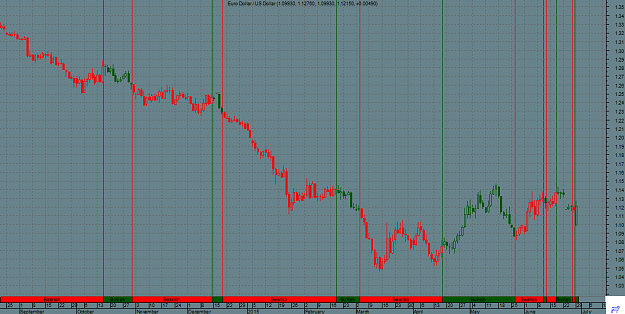
Attached Image (click to enlarge)