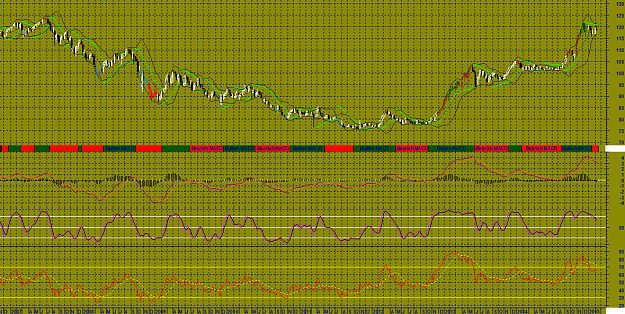
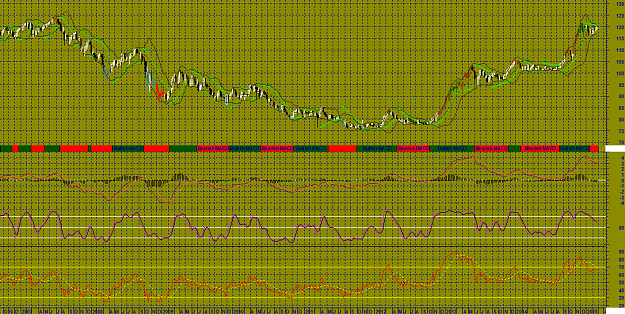
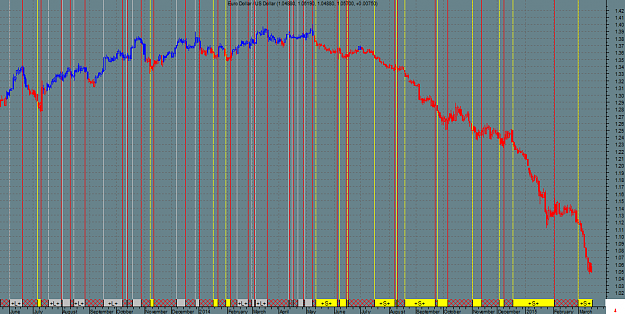
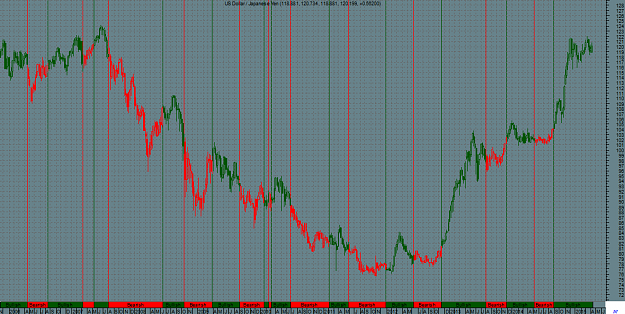
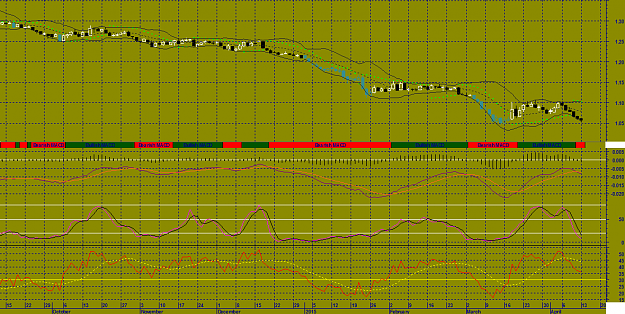
USD/JPY WEEKLY as of Monday, 16 February, 2015
A black body has formed as prices closed lower than open.
The previous 10 candlestick bars, there are 4 white candles versus 6 black candles with a net of 2 black candles.
The previous 50 candlestick bars, there are 31 white candles versus 19 black candles with a net of 12 white candles.
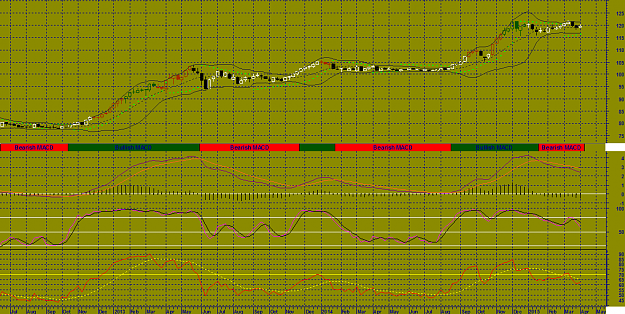
A long upper shadow has formed. This is typically a bearish signal (particularly when it occurs near a high price level, at resistance level, or when the security is overbought).A spinning top has formed which is a candle with a small real body. Spinning tops identify a session in which there is little price action as defined by the difference between the open and the close. During a rally or near new highs, a spinning top can be a sign that prices are losing momentum and the bulls may be in trouble.MACD is BEARISH as the MACD is below the signal line.
The MACD crossed below the signal line 3 period(s) ago. Since the MACD crossed the MACD moving average, US Dollar / Japanese Yen's price has increased 0.85%, and has been fluctuating from a high of 120.471 to a low of 116.873.
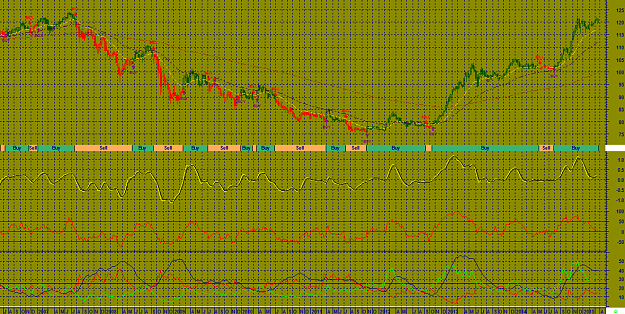
The MACD is currently not in an Overbought/Oversold range.
There have been no divergence signals during the last 5 periods.
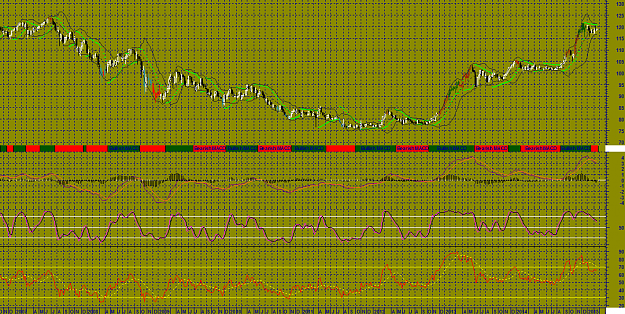
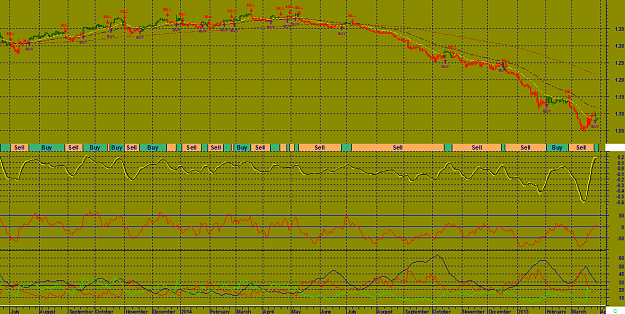
No Stochastic Buy or Sell signals generated today. The last signal was a Sell 118 Period(s) Ago.
The RSI is not currently in a topping (above 70) or bottoming (below 30) range. A buy or sell signal generated when the RSI moves out of an overbought/oversold area. The last signal was a Sell 5 period(s) ago.
Currently the RSI does not show any Failure Swings. The RSI and price of US Dollar / Japanese Yen are not diverging.
Currently, the Momentum Oscillator does not show an overbought or oversold condition.
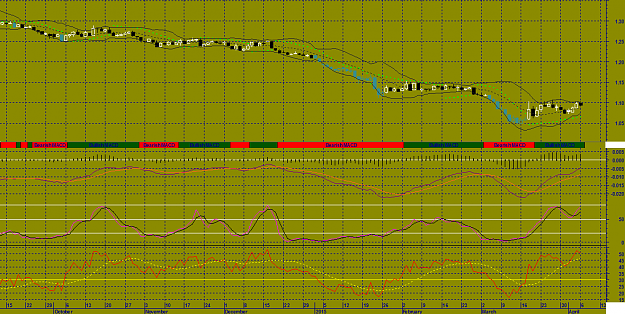
The last Directional Movement Indicators (DMI) signal was a SELL 73 period(s) ago.
There were no SAR signals generated today. The last SAR signal was a Sell 8 period(s) ago.
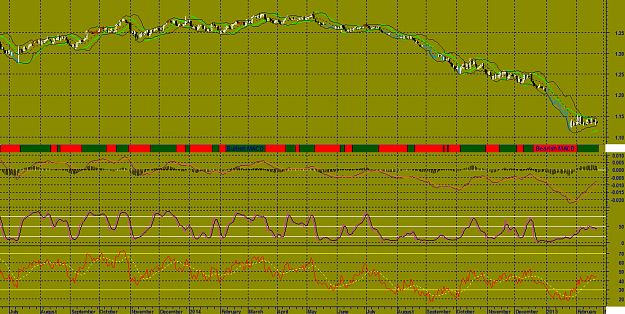
The close is currently
ABOVE its 200 weekly moving average
ABOVE its 50 weekly moving average
ABOVE its 20 weekly moving average
The current market condition for US Dollar / Japanese Yen is Very Bullish
US Dollar / Japanese Yen closed below the upper Bollinger Band by 35.0%. Bollinger Bands are 109.41% wider than normal.
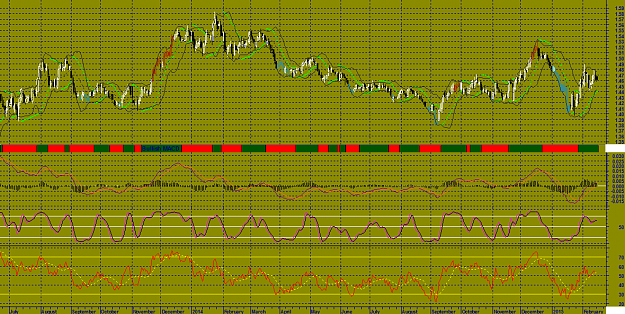
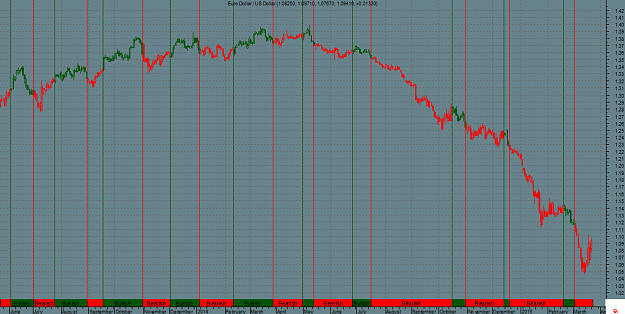
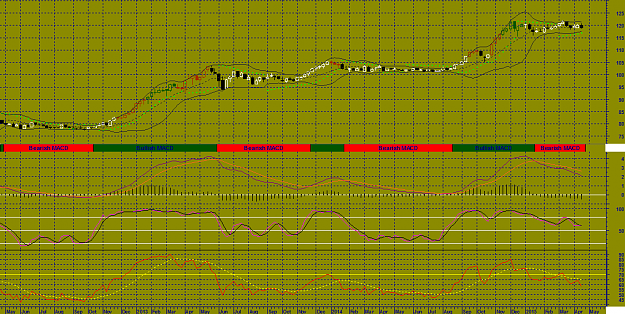
A black body has formed as prices closed lower than open.
The previous 10 candlestick bars, there are 4 white candles versus 6 black candles with a net of 2 black candles.
The previous 50 candlestick bars, there are 31 white candles versus 19 black candles with a net of 12 white candles.
A long upper shadow has formed. This is typically a bearish signal (particularly when it occurs near a high price level, at resistance level, or when the security is overbought).A spinning top has formed which is a candle with a small real body. Spinning tops identify a session in which there is little price action as defined by the difference between the open and the close. During a rally or near new highs, a spinning top can be a sign that prices are losing momentum and the bulls may be in trouble.MACD is BEARISH as the MACD is below the signal line.
The MACD crossed below the signal line 3 period(s) ago. Since the MACD crossed the MACD moving average, US Dollar / Japanese Yen's price has increased 0.85%, and has been fluctuating from a high of 120.471 to a low of 116.873.
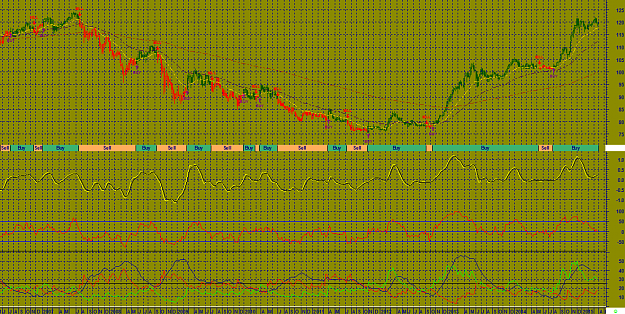
The MACD is currently not in an Overbought/Oversold range.
There have been no divergence signals during the last 5 periods.
No Stochastic Buy or Sell signals generated today. The last signal was a Sell 118 Period(s) Ago.
The RSI is not currently in a topping (above 70) or bottoming (below 30) range. A buy or sell signal generated when the RSI moves out of an overbought/oversold area. The last signal was a Sell 5 period(s) ago.
Currently the RSI does not show any Failure Swings. The RSI and price of US Dollar / Japanese Yen are not diverging.
Currently, the Momentum Oscillator does not show an overbought or oversold condition.
The last Directional Movement Indicators (DMI) signal was a SELL 73 period(s) ago.
There were no SAR signals generated today. The last SAR signal was a Sell 8 period(s) ago.
The close is currently
ABOVE its 200 weekly moving average
ABOVE its 50 weekly moving average
ABOVE its 20 weekly moving average
The current market condition for US Dollar / Japanese Yen is Very Bullish
US Dollar / Japanese Yen closed below the upper Bollinger Band by 35.0%. Bollinger Bands are 109.41% wider than normal.
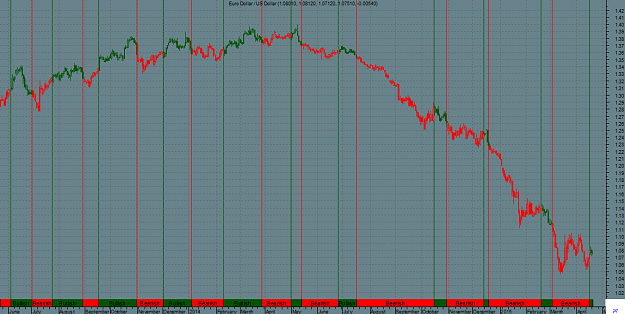
Attached Image (click to enlarge)