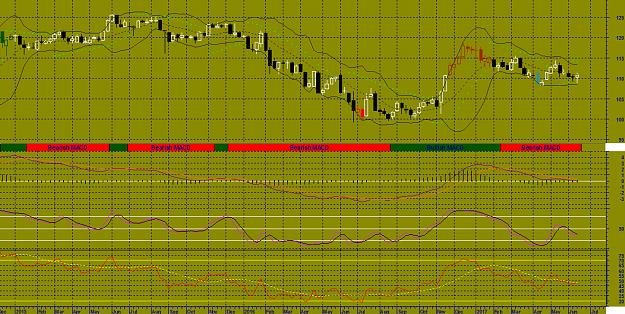
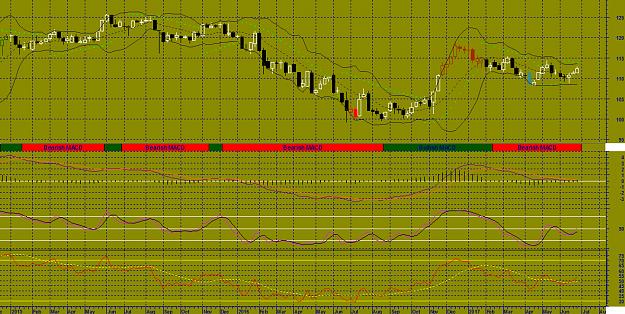
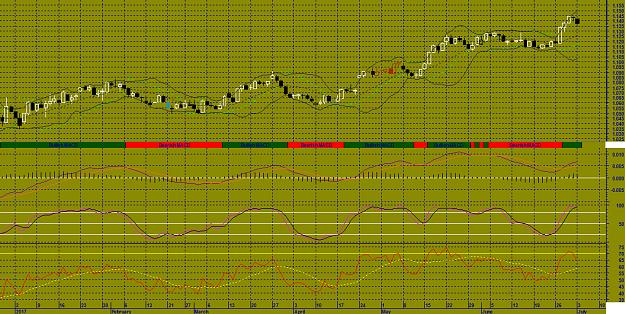
Weekly US Dollar / Japanese Yen-USDJPY As of 16/06/17
A white body has formed as prices closed higher than open.
The previous 10 candlestick bars, there are 7 white candles versus 3 black candles with a net of 4 white candles.
The previous 50 candlestick bars, there are 29 white candles versus 21 black candles with a net of 8 white candles.
MACD is BEARISH as the MACD is below the signal line.
The MACD crossed below the signal line 17 week(s) ago. Since the MACD crossed the MACD moving average, US Dollar / Japanese Yen's price has decreased 1.69%, and has been fluctuating from a high of 115.503 to a low of 108.131.
The MACD is currently not in an Overbought/Oversold range.
There have been no divergence signals during the last 5 periods.
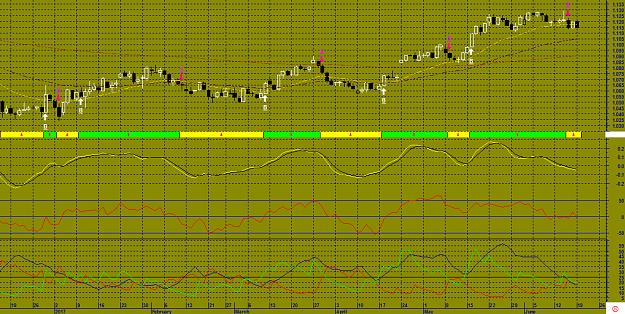
No Stochastic Buy or Sell signals generated today. The last signal was a Buy 6 Week(s) Ago.
The RSI is not currently in a topping (above 70) or bottoming (below 30) range. A buy or sell signal generated when the RSI moves out of an overbought/oversold area. The last signal was a Sell 24 week(s) ago.
Currently the RSI does not show any Failure Swings. The RSI and price of US Dollar / Japanese Yen are not diverging.
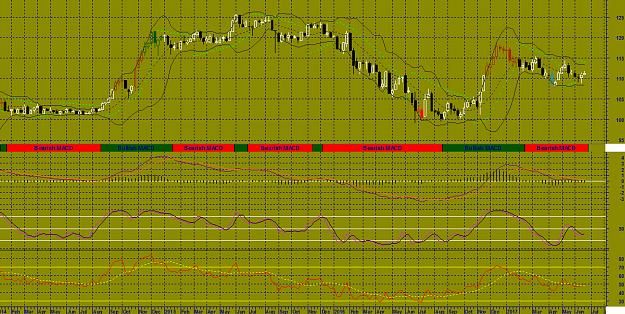
Currently, the Momentum Oscillator does not show an overbought or oversold condition.
The ADX is currently below both Plus and Minus Directional indicators. This should not use to initiate any trades right now.
The Directional Movement Indicators (DMI) currently is not indicating a specific price direction. Because this is a trend following system, it should not use to initiate any trades right now. The last Directional Movement Indicators (DMI) signal was a SELL 12 week(s) ago.
There were no SAR signals generated today. The last SAR signal was a Sell 1 week(s) ago.
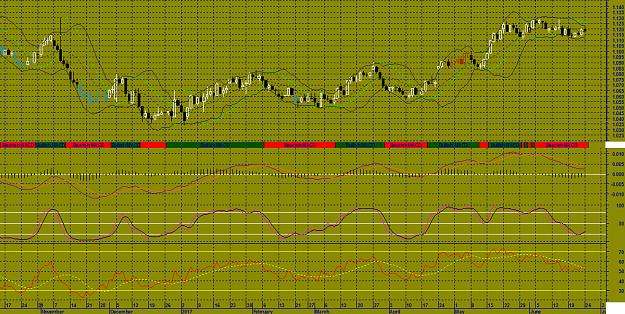
The close is currently
ABOVE its 200 weekly moving average
BELOW its 50 weekly moving average
BELOW its 20 weekly moving average
The current market condition for US Dollar / Japanese Yen is Mildly Bullish
US Dollar / Japanese Yen closed above the lower Bollinger Band by 35.5%. Bollinger Bands are 40.41% narrower than normal. The narrow width of the Bollinger Bands suggests low volatility as compared to US Dollar / Japanese Yen's normal range. Therefore, the probability of volatility increasing with a sharp price move has increased for the near-term. The Bollinger Bands have been in this narrow range for 0 week(s). The probability of a significant price move increases the longer the Bollinger Bands remain in this narrow range.
Attached Image (click to enlarge)